Stat 200 week 3 homework Study guides, Class notes & Summaries
Looking for the best study guides, study notes and summaries about Stat 200 week 3 homework? On this page you'll find 155 study documents about Stat 200 week 3 homework.
All 155 results
Sort by

-
STAT 200 Week 3 Homework Problems
- Exam (elaborations) • 6 pages • 2023
- $13.99
- + learn more
STAT 200 Week 3 Homework Problems
-
STAT 200 Week 3 Homework Problems Solutions, University of Maryland University College (UMUC) STAT 200 Week 3 Homework Problems 4.1.4 A project conducted by the Australian Federal Office of Road Safety asked people many questions about their cars. One que
- Package deal • 4 items • 2022
- $16.09
- + learn more
STAT 200 Week 3 Homework Problems Solutions, University of Maryland University College (UMUC) STAT 200 Week 3 Homework Problems 4.1.4 A project conducted by the Australian Federal Office of Road Safety asked people many questions about their cars. One question was the reason that a person chooses a given car, and that data is in table #4.1.4 ("Car
-
STAT 200 Week 2 Homework Problems and Solutions _ All Answers are Correct
- Exam (elaborations) • 8 pages • 2023
- $9.99
- + learn more
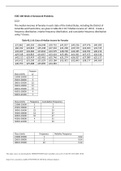
STAT 200 Week 2 Homework Problems 2.2.2 The median incomes of females in each state of the United States, including the District of Columbia and Puerto Rico, are given in table #2.2.10 ("Median income of," 2013). Create a frequency distribution, relative frequency distribution, and cumulative frequency distribution using 7 classes. Table #2.2.10: Data of Median Income for Females $31,862 $40,550 $36,048 $30,752 $41,817 $40,236 $47,476 $40,500 $60,332 $33,823 $35,438 $37,242 $31,238 $39...
-
STAT 200 Week 5 Homework Problems Denize_Shy. (Approach-3), University of Maryland University College (UMUC) 1) According to the February 2008 Federal Trade Commission report on consumer fraud and identity theft, 23% of all complaints in 2007 were for ide
- Exam (elaborations) • 7 pages • 2022
- $17.99
- + learn more
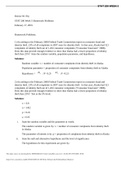
STAT 200 Week 5 Homework Problems Denize_Shy. (Approach-3), University of Maryland University College (UMUC) 1) According to the February 2008 Federal Trade Commission report on consumer fraud and identity theft, 23% of all complaints in 2007 were for identity theft. In that year, Alaska had 321 complaints of identity theft out of 1,432 consumer complaints ("Consumer fraud and," 2008). Does this data provide enough evidence to show that Alaska had a lower proportion of identity theft than 23%...
-
STAT 200 Week 4 Homework Problems Solutions, University of Maryland University College (UMUC) STAT 200 Week 4 Homework Problems 6.1.2 1.) The commuter trains on the Red Line for the Regional Transit Authority (RTA) in Cleveland, OH, have a waiting time du
- Exam (elaborations) • 5 pages • 2022
- $15.99
- + learn more
STAT 200 Week 4 Homework Problems Solutions, University of Maryland University College (UMUC) STAT 200 Week 4 Homework Problems 6.1.2 1.) The commuter trains on the Red Line for the Regional Transit Authority (RTA) in Cleveland, OH, have a waiting time during peak rush hour periods of eight minutes ("2012 annual report," 2012). a.) State the random variable. x=waiting time during peak hours b.) Find the height of this uniform distribution. 1/(8-0)=0.125 c.) Find the probability of waiting bet...

Too much month left at the end of the money?


-
MATH302 WEEK 8 PRACTISE TEST
- Exam (elaborations) • 19 pages • 2022
- $10.49
- + learn more
MATH302 WEEK 8 PRACTISE TEST 2/27/2020 APUS CLE : MATH302 B007 Win 20 : Tests & Quizzes 0.0/ 1.0 Points 1.0/ 1.0 Points Week 8 Knowledge Check Homework Practice Questions Return to Assessment List Part 1 of 4 - Chi-Square Test for Homogeneity 4.0/ 8.0 Points Question 1 of 20 Click to see additional instructions A college prep school advertises that their students are more prepared to succeed in college than other schoverify this, they categorize GPA’s into 4 groups and look up the...
-
STAT 200 Week 6 Homework Problems, full solution guide, 100% correct. and graded A
- Exam (elaborations) • 11 pages • 2022
- $13.49
- + learn more
STAT 200 Week 6 Homework Problems 9.1.2 Many high school students take the AP tests in different subject areas. In 2007, of the 144,796 students who took the biology exam 84,199 of them were female. In that same year, of the 211,693 students who took the calculus AB exam 102,598 of them were female ("AP exam scores," 2013). Estimate the difference in the proportion of female students taking the biology exam and female students taking the calculus AB exam using a 90% confidence level. n1...
-
STAT 200 Week 6 Homework Problems, full solution guide, 100% correct.
- Other • 10 pages • 2022
- $12.49
- + learn more
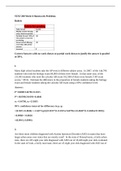
STAT 200 Week 6 Homework Problems Rubric Correct Answers with no work shown or partial work shown to justify the answer is graded at 50%. 1. Many high school students take the AP tests in different subject areas. In 2007, of the 144,796 students who took the biology exam 84,000 of them were female. In that same year, of the 211,693 students who took the calculus AB exam 102,598 of them were female ("AP exam scores," 2013). Estimate the difference in the proportion of female students ta...

-
STAT 200 Week 6, Verified Answers Well Explained, Already Graded A+ 2022 updateSTAT 200 Week 6 Homework Problems 9.1.2 Many high school students take the AP tests in different subject areas. In 2007, of the 144,796 students who took the biology exam 84,19
- Exam (elaborations) • 11 pages • 2022
- $19.49
- + learn more
STAT 200 Week 6 Homework Problems 9.1.2 Many high school students take the AP tests in different subject areas. In 2007, of the 144,796 students who took the biology exam 84,199 of them were female. In that same year, of the 211,693 students who took the calculus AB exam 102,598 of them were female ("AP exam scores," 2013). Estimate the difference in the proportion of female students taking the biology exam and female students taking the calculus AB exam using a 90% confidence level. n1...
-
STAT 200 Week 3 Homework Problems answers 2023
- Exam (elaborations) • 6 pages • 2023
- $2.99
- + learn more
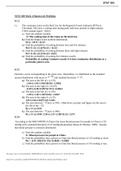
TAT 200 Week 3 Homework Problems 4.1.4 A project conducted by the Australian Federal Office of Road Safety asked people many questions about their cars. One question was the reason that a person chooses a given car, and that data is in table #4.1.4 ("Car preferences," 2013). Table #4.1.4: Reason for Choosing a Car Safety Reliability Cost Performance Comfort Looks 84 62 46 34 47 27 Find the probability a person chooses a car for each of the given reasons. Total: 84+62+46+34+47+27=3...
