Math 302 final exam 2 Study guides, Class notes & Summaries
Looking for the best study guides, study notes and summaries about Math 302 final exam 2? On this page you'll find 113 study documents about Math 302 final exam 2.
All 113 results
Sort by
-
MATH 302 Final Exam 2 - Question and Answers updated version
- Exam (elaborations) • 17 pages • 2023
- $16.49
- + learn more
MATH 302 Final Exam 2 - Question and Answers updated version
-
MATH 302 Final Exam 2
- Exam (elaborations) • 11 pages • 2022
- $30.49
- + learn more
MATH 302 Final Exam Part 1 of 16 - 1. The data presented in the table below resulted from an experiment in which seeds of 5 different types were planted and the number of seeds that germinated within 5 weeks after planting was recorded for each seed type. At the .01 level of significance, is the proportion of seeds that germinate dependent on the seed type? 2. The chi-square goodness-of-fit test can be used to test for: 3. In choosing the “best-fitting” line through a set of points in ...
-
MATH 302: INTRODUCTION TO PROBABILITY FINAL EXAM 2022/2023(MAY-AUGUST QTR) 100% CORRECT AND VRIFIED ANSWERS FOR DISTINTION PASS (Highly RECOMMENDED)
- Exam (elaborations) • 66 pages • 2023
- $14.99
- + learn more
Question 1 of 20 1.0/ 1.0 Points Which of the following statements are false regarding a boxplot? A. The height of the box has no significance. B. Boxplots can be used to either describe a single variable in a data set or to compare two (or more) variables C. The length of the box equals the range of the data. D. The right and left of the box are the third and first quartiles Answer Key: C Question 2 of 20 1.0/ 1.0 Points A histogram that has a single peak and looks approximatel...
-
Math 302 Final Exam 2021 - American University | Math302 Final Exam_Graded A - American University
- Exam (elaborations) • 114 pages • 2022
- $12.99
- + learn more
MATH 302 Final Exam 2021 - American University QUIZ 1 Question 1 of 20 1.0/ 1.0 Points Which of the following statements are false regarding a boxplot? A. The height of the box has no significance. B. Boxplots can be used to either describe a single variable in a data set or to compare two (or more) variables C. The length of the box equals the range of the data. D. The right and left of the box are the third and first quartiles Answer Key: C Question 2 of 20 1.0/ 1.0 Point...
-
MATH 302 Quiz 1 - Question and Answers
- Exam (elaborations) • 11 pages • 2022
- $11.99
- + learn more
MATH 302 Quiz 1 Part 1 of 3 1. A histogram that is positively skewed is also called 2. Researchers may gain insight into the characteristics of a population by examining a 3. A variable is classified as ordinal if: 4. A sample of 20 observations has a standard deviation of 4. The sum of the squared deviations from the sample mean is: 5. A pareto chart does NOT have which of the following properties? 6. What type of graph is the figure below? 7. Numerical variables can be subdivided i...

As you read this, a fellow student has made another $4.70

-
MATH 302 Quiz 1 Set 1
- Exam (elaborations) • 11 pages • 2022
- $9.99
- + learn more
MATH 302 Quiz 1 1. An advertisement for a car states that it is 10% more powerful than its competitor. This is an example of 2. A scatterplot allows one to see: 3. Which of the following are the two most commonly used measures of variability? 4. A histogram that has a single peak and looks approximately the same to the left and right of the peak is called: 5. What kind of relationship between x and y is demonstrated by the scatter plot below? 6. Which of the following statements is true re...
-
MATH 302 Final Exam 2 - Question and Answers
- Exam (elaborations) • 16 pages • 2022
- $16.49
- + learn more
MATH 302 Final Exam 2 - Question and Answers
-
MATH 302 Quiz 1 Set 3
- Exam (elaborations) • 9 pages • 2022
- $11.99
- + learn more
Math 302 quiz 1 1. What is the term for a characteristic or attribute that can assume different values? 2. A pareto chart does NOT have which of the following properties? 3. Suppose that a histogram of a data set is approximately symmetric and "bell shaped". Approximately what percent of the observations are within two standard deviations of the mean? 4. Suppose that a histogram of a data set is approximately symmetric and "bell shaped". Approximately, what percent of the observations ar...

-
MATH 302 Final Exam 2 - Question and Answers
- Exam (elaborations) • 16 pages • 2021
- $15.00
- + learn more
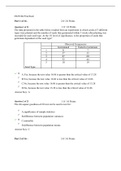
MATH 302 Final Exam 2 - Question and AnswersThe data presented in the table below resulted from an experiment in which seeds of 5 different types were planted and the number of seeds that germinated within 5 weeks after planting was recorded for each seed type. At the .01 level of significance, is the proportion of seeds that germinate dependent on the seed type? Seed Type Observed Frequencies Germinated Failed to Germinate 1 31 7 2 57 33 3 87 60 4 52 44 5 10 19 A.Yes, because th...
-
MATH 302 Final Exam 1
- Exam (elaborations) • 12 pages • 2022
- $30.49
- + learn more
MATH 302 Final Exam Part 1 of 16 - 1. A cCompany operates four machines during three shifts each day. From production records, the data in the table below were collected. At the .05 level of significance test to determine if the number of breakdowns is independent of the shift. 2. The chi-square goodness-of-fit test can be used to test for: Part 2 of 16 - 3. In a simple linear regression analysis, the following sum of squares are produced: 4. ____________ is/are especially helpful in...
