Using minitab Study guides, Class notes & Summaries
Looking for the best study guides, study notes and summaries about Using minitab? On this page you'll find 54 study documents about Using minitab.
Page 4 out of 54 results
Sort by
-
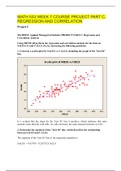
MATH 533 WEEK 7 COURSE PROJECT PART C, REGRESSION AND CORRELATION- PERFECT
- Exam (elaborations) • 5 pages • 2021
- $15.49
- + learn more
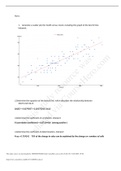
MATH 533 WEEK 7 COURSE PROJECT PART C, REGRESSION AND CORRELATION- PERFECT MATH 533 Week 7 Course Project Part C: Regression and Correlation Analysis Using Minitab, perform the regression and correlation analysis for the data on SALES (Y) and CALLS (X) by answering the following questions. Generate a scatterplot for SALES versus CALLS, including the graph of the best fit line. Interpret. Determine the equation of the best fit line, which describes the relationship between SALES and CALLS...
-
(answered) STAT 200 STAT200 LAB 7 COMMON DISTRIBUTIONS - PENN STATE
- Other • 7 pages • 2021
- $6.99
- + learn more
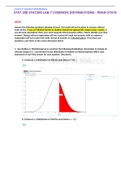
(answered) STAT 200 STAT200 LAB 7 COMMON DISTRIBUTIONS - PENN STATE STAT 200 Lab 7 Common Distributions STAT 200 STAT200 LAB 7 COMMON DISTRIBUTIONS - PENN STATE NAME: Answer the following questions showing all work. Full credit will not be given to answers without work shown. If you use Minitab Express or StatKey include the appropriate output (copy + paste). If you do hand calculations show your work using the Word equation editor. Clearly identify your final answers. Output without e...
-
MATH 533 FINAL EXAM 2- ALREADY GRADED A
- Exam (elaborations) • 13 pages • 2021
- $10.49
- + learn more
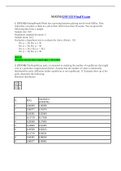
MATH 533 FINAL EXAM 2- ALREADY GRADED A DESCRIPTION MATH 533 Final Exam 1. (TCO D) Putting People to Work has a growing business placing out-of-work MBAs. They claim they can place a client in a job in their field in less than 36 weeks. You are ……the following data from a sample. Sample size: 100 – Population standard deviation: 5 – Sample mean: 34.2 – Formulate a hypothesis test to evaluate the claim. 2. (TCO B) The Republican party is interested in studying the number of rep...

-
QNT/351 Week 5, team assignment If using the Ballard Integrated Managed Services, Inc. (BIMS) case study overview: Resource: University of Phoenix Material: Ballard Integrated Managed Services, Inc., Part 2. Read the University of Phoenix Material: Ba
- Summary • 3 pages • 2021
- $3.49
- + learn more
QNT/351 Week 5, team assignment If using the Ballard Integrated Managed Services, Inc. (BIMS) case study overview: Resource: University of Phoenix Material: Ballard Integrated Managed Services, Inc., Part 2. Read the University of Phoenix Material: Ballard Integrated Managed Services, Inc., Part 2. Your team acts as a consultant group that analyzes and interprets this second set of data. The intent is to increase senior management's understanding of the sources of employee dissatisfaction a...
-
MATH 533 WEEK 7 COURSE PROJECT PART C, REGRESSION AND CORRELATION
- Exam (elaborations) • 5 pages • 2020
- $19.49
- + learn more
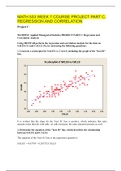
Using Minitab, perform the regression and correlation analysis for the data on SALES (Y) and CALLS (X) by answering the following questions. Generate a scatterplot for SALES versus CALLS, including the graph of the best fit line. Interpret. Determine the equation of the best fit line, which describes the relationship between SALES and CALLS. Determine the coefficient of correlation. Interpret. Determine the coefficient of determination. Interpret math 533 week 7 course project Test the utility ...

And that's how you make extra money

-
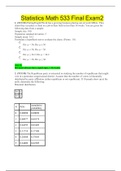
Statistics Math 533 Final Exam2
- Exam (elaborations) • 13 pages • 2020
- $15.49
- + learn more
MATH 533 Final Exam 1. (TCO D) Putting People to Work has a growing business placing out-of-work MBAs. They claim they can place a client in a job in their field in less than 36 weeks. You are ……the following data from a sample. Sample size: 100 – Population standard deviation: 5 – Sample mean: 34.2 – Formulate a hypothesis test to evaluate the claim. 2. (TCO B) The Republican party is interested in studying the number of republicans that might vote in a particular congressional dist...
-
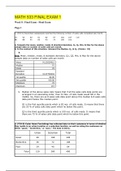
MATH 533 FINAL EXAM 1
- Exam (elaborations) • 13 pages • 2020
- $15.49
- + learn more
MATH 533 Final Exam (TCO A) Seventeen salespeople reported the following number of sales calls completed last month. (TCO B) Cedar Home Furnishings has collected data on their customers in terms of whether they reside in an urban location. Or a suburban location, as well as rating the customers as either “good,” “borderline,” or “poor.” The data is below (TCO B) Historically, 70% of your customers at Rodale Emporium pay for their purchases using credit cards. In a sample of 20 custo...
-
MATH 533 WEEK 7 COURSE PROJECT PART C, REGRESSION AND CORRELATION
- Exam (elaborations) • 5 pages • 2020
- $15.49
- + learn more
MATH 533 WEEK 7 COURSE PROJECT PART C, REGRESSION AND CORRELATION
-
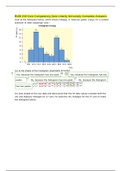
BUSI 230 > Liberty University - Core Competency Quiz - Complete Answers. Already Graded A.
- Exam (elaborations) • 21 pages • 2019
- $8.49
- + learn more
BUSI 230 Core Competency Quiz (Latest) Look at the histogram below, which shows mileage, in miles per gallon (mpg), for a random selection of older passenger cars. (a) Is the shape of the histogram essentially bimodal? (b) Jose looked at the raw data and discovered that the 54 data values included both the city and highway mileages for 27 cars. He used the city mileages for the 27 cars to make the histogram below. Using this information and the histograms shown above, construct a frequency t...

-
MATH 533 WEEK 7 COURSE PROJECT PART C, REGRESSION AND CORRELATION
- Exam (elaborations) • 5 pages • 2020
- $10.99
- + learn more
MATH 533 WEEK 7 COURSE PROJECT PART C, REGRESSION AND CORRELATION
