Math 533 Study guides, Class notes & Summaries
Looking for the best study guides, study notes and summaries about Math 533? On this page you'll find 265 study documents about Math 533.
Page 3 out of 265 results
Sort by
-
MATH 533 Entire Course Week 1 – 8 BUNDLED | Documents To help pass in the exams | 100% correct solutions
- Package deal • 18 items • 2022
- $19.49
- + learn more
MATH 533 Week 1 Homework Problems MATH-533 Week 1 Discussion: Graphing Data On USA Immigration MATH 533 Week 1 Discussion: Study and Sample Design MATH-533 Week 1 Quiz – Solutions MATH 533 Week 2 Course Project Part A: Exploratory Data Analysis MATH-533 Week 2 Homework Problems MATH 533 Week 2 Textbook Homework Questions MATH-533 Week 2 Disc
-
MATH 533 Week 7 Course Project Part C: Regression and Correlation Analysis | Already GRADED A+
- Other • 15 pages • 2022
- $10.99
- + learn more
MATH 533 Week 7 Course Project Part C: Regression and Correlation Analysis | Already GRADED A+
-
Math-533 Applied Managerial Statistics..
- Exam (elaborations) • 13 pages • 2023
- $17.99
- + learn more
Math-533 Applied Managerial Statistics..Math-533 Applied Managerial Statistics..Math-533 Applied Managerial Statistics..
-
MATH-533 Week 1 Addendum: Homework-Quiz Review – With 100% Correct Answers
- Other • 4 pages • 2024
- $15.49
- + learn more
MATH-533 Week 1 Addendum: Homework-Quiz Review – With 100% Correct Answers Week 2 Homework and Quiz Review 1. True/False. 2.13 in valid probability. ANSWER: False 2. True/False. The union of two events is the probability of both events occuring. ANSWER: False 3. Determine if each variable below is discrete or continuous: • Number of cars in the parking lot. ANSWER: Discrete • Width of tree trunk. ANSWER: Continuous 4. Given: We have a sample space S with several events defined on it. S={2,...

-
MATH 533 Week 7 Course Project Part C Regression and Correlation Analysis
- Exam (elaborations) • 15 pages • 2022
- $12.99
- + learn more
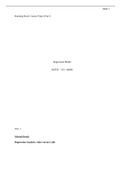
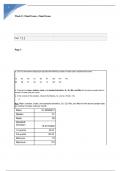
Running Head: Course Project Part C Regression Model MATH – 533 - 60846 Ans .1 Minitab Result Regression Analysis: Sales versus Calls Math 2 The regression equation is Sales = 9.638 + 0.2018 Calls 120 130 140 150 160 170 180 190 200 210 55 50 45 40 35 30 S 2.05708 R-Sq 75.9% R-Sq(adj) 75.7% Calls Sales Fitted LinePlot Sales= 9.638 + 0.2018 Calls It is evident with the help of scatter graph trend line that there is positive relationship between Sales and calls. If numbe...

Make study stress less painful

-
MATH 533 Week 5 Homework Problems/Solutions (GRADED A) Questions and Answer solutions | Already RATED A+
- Exam (elaborations) • 7 pages • 2022
- $10.99
- + learn more
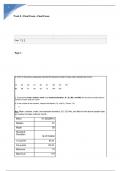
Question 7.2.11: Several years ago, a government agency reported the default rate (the proportion of borrowers who default on their loans) on a certain type of loan at 0.055. Set up the null and alter native hypotheses to determine if the default rate this year is greater than 0.55. Question 7.2.13: A university economist conducted a study of elementary school lunch menus. During the state-mandated testing period, school lunches averaged 877 calories. The economist claimed that after the testing...

-
MATH 533 Week 7 Course Project C
- Exam (elaborations) • 10 pages • 2022
- $18.49
- + learn more
MATH 533 Week 7 Course Project C
-
MATH-533 Week 1 Quiz – Download For Revision And Improve Your Grades
- Other • 2 pages • 2024
- $7.99
- + learn more
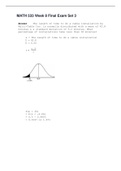
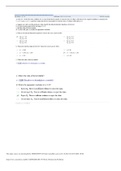
1. Graph the relative frequency histogram for the 300 measurements summarized in the relative frequency table to the right. 2. Would you expect the data sets that follow to possess relative frequency distributions that are symmetric, skewed to the right, or skewed to the left? Explain. Complete parts a through c below. 3. Consider the following sample of five measurements. 3, 4, 5, 2, 6 4. MINITAB was used to generate the histogram to the right. 5. A university’s language professors incorp...
-
Exam Statistics Math 533 Final Exam 2
- Exam (elaborations) • 27 pages • 2024
- $15.99
- + learn more
Exam Statistics Math 533 Final Exam 2 Exam Statistics Math 533 Final Exam 2 Exam Statistics Math 533 Final Exam 2
-
Statistics Math 533 Final Exam 2 questions with answers
- Exam (elaborations) • 27 pages • 2024
- $20.49
- + learn more
Statistics Math 533 Final Exam 2 questions with answers Statistics Math 533 Final Exam 2 questions with answers Statistics Math 533 Final Exam 2 questions with answers
