Ap stat Study guides, Class notes & Summaries
Looking for the best study guides, study notes and summaries about Ap stat? On this page you'll find 825 study documents about Ap stat.
Page 2 out of 825 results
Sort by
-
AP Statistics Exam Study Guide Questions With Complete Solutions
- Exam (elaborations) • 33 pages • 2023
- $12.99
- + learn more
How is a population measured? correct answer: a population is measured by a census. How is a sample measured? correct answer: A sample is measured using a sampling technique, of which there are several. Why do we often measure samples instead of populations? correct answer: Collecting data from an entire population is often impossible, infeasible, or beyond the capability of the resources we have available. Samples can supply good estimates of the population, and are much easier to coll...
-
AP Statistics Exam Review Questions With Complete Solutions
- Exam (elaborations) • 33 pages • 2023
- $12.99
- + learn more
What is a dotplot? correct answer: A graphical display which shows "dots" for each point. It's good for categorical data- ie data classified into categories. What's the difference between categorical and quantitative data? correct answer: Categorical data fits into various categories; whereas, quantitative data has numerical values associated with it. What is a bar chart? correct answer: A display for categorical data which indicates frequencies or percents for each category. Wha...
-
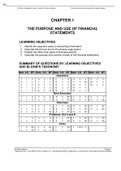
Solutions manual for understanding financial accounting, 3rd canadian edition, by christopher burnley(chapters 1-14)Rated A+
- Exam (elaborations) • 1628 pages • 2023
- $27.99
- 4x sold
- + learn more
Solutions manual for understanding financial accounting, 3rd canadian edition, by christopher CHAPTER 1 THE PURPOSE AND USE OF FINANCIAL STATEMENTS LEARNING OBJECTIVES 1. Identify the uses and users of accounting information. 2. Describe the primary forms of business organization. 3. Explain the three main types of business activity. 4. Describe the purpose and content of each of the financial statements. SUMMARY OF QUESTIONS BY LEARNING OBJECTIVES AND BLOOM’S TAXONOMY Item LO BT Ite...
-
AP Statistics Questions And Answers With Complete Solutions
- Exam (elaborations) • 21 pages • 2023
- $12.99
- + learn more
5 number summary correct answer: The minumum value, lower quartile, median, upper quartile, and maximum value for a data set. These five values give a summary of the shape of the distribution and are used to make box plots. The five numbers that help describe the center, spread and shape of data z score correct answer: a measure of how many standard deviations you are away from the norm (average or mean) -Number of standard deviations a score is above or below the mean (positive...
-
AP Stat - Chapters 1-4 - Multiple Choice - Cumulative Test 2023/2024 already passed
- Exam (elaborations) • 10 pages • 2023
- $17.99
- + learn more
AP Stat - Chapters 1-4 - Multiple Choice - Cumulative Testthe following histogram represents the distribution of acceptance rates (% accepted) among 25 business schools in 1997, what % of schools have an acceptance rate above 40% - correct answer know how to read a histogram (variable vs. freq, fraction -> %) you want to use numerical summaries to describe a distribution that is strongly skewed to the left, which combination of measure of center and spread would be the best to use (mean an...

Fear of missing out? Then don’t!

-
AP stats study guide 2024
- Exam (elaborations) • 76 pages • 2024
- $9.49
- + learn more
AP stats study guide 2024
-
AP Statistics Exam Review Questions And Answers
- Exam (elaborations) • 13 pages • 2023
- $11.49
- + learn more
To describe categorical data... correct answer: Make a picture. Bar graphs or pie charts work well. Summarize the distribution with a table of counts or relative frequencies (percents) in each category. Compare distributions with plots side by side. Interpret Standard Deviation correct answer: Standard deviation measures spread by giving the "typical" or "average" distance that the observations (context) are away from their (context) mean. Outlier Rule correct answer: Upper Bound ...
-
AP Statistics Summary ALL SOLUTION 2023/24 EDITION GUARANTEED GRADE A+
- Summary • 72 pages • 2023
- $14.49
- + learn more
Variables can be ________ or ________. quantitative, qualitative ________ is the use of data to make informed decisions. Statistics Which of the following options is the correct answer to the problem? 4+5(23)-(16) = ________ 22 Statistics in Latin is ________, which means "state." status ________ research is best for testing cause and effect relationships between variables. Experimental A sample is________. a subgroup of the population Any eve...
-
AP Stats Exam Review - Stats Medic Questions With Complete Solutions
- Exam (elaborations) • 12 pages • 2023
- $10.49
- + learn more
How to describe a 1-variable distribution correct answer: SOCS + context Ways to describe the shape of a distribution (S) correct answer: Symmetric = balanced on both sides of the center Skewed right = tail (part with less stuff) is located to the right of the center Skewed left = tail is located to the left of the center When describing this part of a distribution, always use -ly words in your description (fairly, slightly, strongly, appropriately, etc.) Outlier Formula (3rd Qu...
-
Trimester 1 AP Statistics Final Exam Review Questions With Complete Solutions
- Exam (elaborations) • 30 pages • 2023
- $12.99
- + learn more
Individual correct answer: Person or thing described by a data set Variable correct answer: any characteristic of an individual (usually varies from one individual to another) Categorical variable vs Quantitative variable correct answer: Categorical (qualitative) variable: places each individual into ONE of several groups (can even be a number range; e.g. age, zip code) ***ALWAYS USE BAR GRAPH FOR CATEGORICAL VARIABLES*** Quantitative variable: numerical values ***for which it makes ...
