MATH 399N (MATH399N)
Chamberlain College Nursing
Page 3 out of 37 results
Sort by
-
MATH 399N Week 3 Discussion; Statistics and Probability in the News
- Other • 2 pages • 2023
- $20.49
- + learn more
Initial Post Instructions Keep your eyes and ears open as you read or listen to the news this week. Find/discover an example of statistics & probability in the news to discuss the following statement that represents one of the objectives of statistics analysis: "Statistics and Probability helps us make decisions based on data analysis." Briefly discuss how the news item or article meets this objective. Cite your references. Also, keep in mind and discuss how the impact of your study on your p...
-
MATH 399 Week 1 Assignment; Skewness and Standard Deviation
- Other • 104 pages • 2023
- $45.49
- + learn more
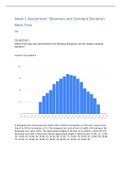
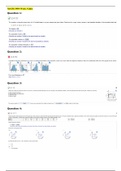
1. Which of the data sets represented by the following histograms has the smallest standard deviation? 2. Question: A food processing plant fills snack-sized bags of crackers. The mean number of crackers in each bag is 22and the standard deviation is 2. The factory supervisor selects one bag that contains 24crackers. 3. Question: The following data set represents the ages of all 6 of Nancy's grandchildren. 4. Question: Which of the following frequency tables show a skewed data set? Select al...
-
MATH 399 Week 7 Knewton Homework Assignment; Conduct a Hypothesis Test for Mean - Population Standard Deviation Unknown - Critical Value (Section 9.5)
- Other • 5 pages • 2023
- $25.49
- + learn more
1. Question: A linguistics expert is interested in learning about the amount of time people in his industry spend studying a new language. A random sample of 15people in his industry were surveyed for a hypothesis test about the mean time people studied a new language last year. He conducts a one-mean hypothesis test, at the 10%significance level, to test the recent publication that the amount of time people in his industry are studying a new language was 30minutes per week. dfdf t0.10t0.10 t0...
-
MATH 399 Week 1 Assignment; Skewness and Standard Deviation Work Time
- Other • 21 pages • 2023
- $49.49
- + learn more
1. Which of the data sets represented by the following histograms has the smallest standard deviation? 2. Question: A food processing plant fills snack-sized bags of crackers. The mean number of crackers in each bag is 22and the standard deviation is 2. The factory supervisor selects one bag that contains 24crackers. 3. Question: The following data set represents the ages of all 6 of Nancy's grandchildren. 4. Question: Which of the following frequency tables show a skewed data set? Select al...

Fear of missing out? Then don’t!

-
MATH 399N - Statistics for Decision Making Week 6 iLab. Questions & Answers. (Rationales Provided)
- Exam (elaborations) • 3 pages • 2021
- $9.99
- + learn more
MATH 399N - Statistics for Decision Making Week 6 iLab. Questions & Answers. (Rationales Provided)
-
MATH 534 Course Project Altogether Part A, B, C
- Exam (elaborations) • 6 pages • 2021
- $14.99
- + learn more
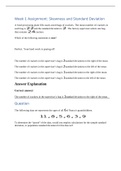
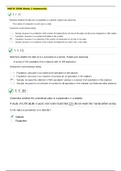
1. Determine if each of the following represents nominal, ordinal, interval, or ratio data. 2. The following numbers represent the weights in pounds of six 7- year old children in Mrs. Jones' 2nd grade class. {25, 60, 51, 47, 49, 45} 3. If the variance is 846, what is the standard deviation? 4. If we have the following data 5. What type of sampling technique is (a) a wheat field is divided into sections and a random sample of stocks are taken from each section, and (b) a manufactur...
-
MATH 399N Week 2 Lab
- Other • 8 pages • 2020
- $13.98
- + learn more
MATH 399N Week 2 Lab MATH 399N Week 2 Lab MATH 399N Week 2 Lab
-
MATH 399N Week 3 Quiz with Answers
- Exam (elaborations) • 6 pages • 2020
- $13.98
- + learn more
MATH 399N Week 3 Quiz with Answers.MATH 399N Week 3 Quiz with Answers.MATH 399N Week 3 Quiz with Answers.MATH 399N Week 3 Quiz with Answers.MATH 399N Week 3 Quiz with Answers
-
MATH 399N Week 1 Homework
- Exam (elaborations) • 7 pages • 2020
- $13.98
- + learn more
MATH 399N Week 1 Homework.MATH 399N Week 1 Homework.MATH 399N Week 1 Homework
