DATA SCIEN
Great Lakes Christian College
All 6 results
Sort by
-
Data science >Machine Learning Project.html.2023& study guide with complete solution
- Other • 72 pages • 2023
- $10.49
- + learn more
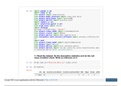
import pandas as pd import numpy as np from sklearn import preprocessing from _selection import train_test_split from _bayes import GaussianNB from cs import accuracy_score import seaborn as sns import t as plt from import zscore import warnings rwarnings( "ignore") from r_model import LinearRegression from er import KMeans from cs import mean_squared_error from ers_influence import variance_inflation_fac tor import math from r_model import LogisticRegression from sklearn im...

-
SANDYA VB- TIME SERIES FORECASTING PROJECT 2023& study guide with complete solution
- Other • 196 pages • 2023
- $9.49
- 1x sold
- + learn more
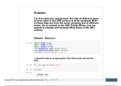
Problem: For this particular assignment, the data of different types of wine sales in the 20th century is to be analysed. Both of these data are from the same company but of different wines. As an analyst in the ABC Estate Wines, you are tasked to analyse and forecast Wine Sales in the 20th century. Dataset - R In [1]: import numpy as np import pandas as pd import seaborn as sns from matplotlib import pyplot as plt from import rcParams rcParams['ze'] = 13, 6 1. Read the data as ...
-
SANDYA VB-Business Report TSF 2023& study guide with complete solution (Solved)
- Exam (elaborations) • 24 pages • 2023
- $9.49
- + learn more
1. Read the data as an appropriate Time Series data and plot the data. The two datasets: Rose and Sparkling are imported using the read command. And convert to time series data using date_range function: date = _range(start='01/01/1980', end='08/01/1995', freq='M')date df['Time_Stamp'] = pd.DataFrame(date,columns=['Month']) () o/p: ROSE WINE YEAR WISE SALES • From the above plot we observe that there is a decreasing trend in the initial years and stabilizes over the years...

-
DATA SCIEN>MRA Project MIlestone1 /MARKETING & RETAIL ANALYTICS
- Other • 29 pages • 2023
- $9.49
- + learn more
MARKETING & RETAIL ANALYTICS
-
DATA SCIEN MRA Project Milestone 2
- Other • 20 pages • 2023
- $9.49
- + learn more
MARKETING & RETAIL ANALYTICS MILESTONE - 2 ▪ A Grocery Store shared the transactional data with you. Your job is to identify the most popular combos that can be suggested to the Grocery Store chain after a thorough analysis of the most commonly occurring sets of items in the customer orders. The Store doesn’t have any combo offers. Can you suggest the best combos & offers? ▪ DATA: dataset_ z TOOLS USED ▪ TABLEAU Tool: Used for Exploratory Analysis Link: ▪ PYTHON Tool: U...

Fear of missing out? Then don’t!

-
SANDYA VB- TIME SERIES FORECASTING PROJECT.
- Case • 196 pages • 2023
- $9.49
- 2x sold
- + learn more
Problem: For this particular assignment, the data of different types of wine sales in the 20th century is to be analysed. Both of these data are from the same company but of different wines. As an analyst in the ABC Estate Wines, you are tasked to analyse and forecast Wine Sales in the 20th century. Dataset - R In [1]: import numpy as np import pandas as pd import seaborn as sns from matplotlib import pyplot as plt from import rcParams rcParams['ze'] = 13, 6 1. Read the data as ...
