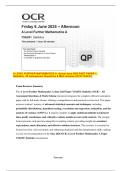
A LEVEL FURTHER MATHEMATICS A: Actual June 2025 PAST PAPER 1:
Statistics. All Assessment Questions & Mark Scheme [OCR Y542/01]
Exam Resource Summary
The A Level Further Mathematics A June 2025 Paper Y542/01: Statistics (OCR) – All
Assessment Questions & Mark Scheme document integrates the complete official examination
paper with its full mark scheme, offering a comprehensive and practical revision tool. This paper
assesses students’ mastery of advanced statistical concepts and techniques, including
probability distributions, hypothesis testing, correlation and regression, estimation, and the
analysis of variance (ANOVA). It requires students to apply statistical methods to interpret
data, justify conclusions, and critically evaluate models in real-world contexts. The merged
format presents each question alongside its marking criteria, providing insight into examiner
expectations, mark allocation, and effective solution structure. This resource is essential for
focused revision, self-assessment, and enhancing analytical and data interpretation skills, making
it a key tool for preparation for the May 2026 OCR A Level Further Mathematics A Paper
Y542/01: Statistics examination.
Turn over
, 2
1 A set of 16 observations of the bivariate data (X, Y ) are summarised as follows.
n = 16 / x = 136 / y = 352 / x2 = 1496 / y2 = 9104 / xy = 3642
Determine an estimate of the value of y corresponding to x = 8.5. [4]
2 The number of trees of a particular species found in 1km2 of a forest can be modelled by the
distribution Po(m).
The forest consists of two regions, A and B.
In the region A, m = 4. The number of trees of this species in a randomly chosen area of 3km2 in
region A is denoted by X.
(a) Find P(16 1 X 1 20). [3]
In region B, m = 8. The number of trees of this species in a randomly chosen area of 3km2 in
region B is denoted by Y.
The random variable Z is defined by Z = X + Y . It may be assumed that X and Y are independent.
(b) Write down a formula for P(Z = z), in terms of z. [2]
(c) The average numbers of trees of this species in one square kilometre are not the same in
regions A and B.
Explain why the associated modelling assumption for the distribution of Z is nevertheless
valid. [1]
(d) Show that Y - X does not have a Poisson distribution. [1]
© OCR 2025 Y542/01 Jun25
, 3
3 The length, in cm, of sand lizards when fully grown is a random variable which is known to have
the distribution N(13.2, 3.42).
Some scientists discover a colony of what they believe to be sand lizards in a remote location.
The scientists measure the lengths of a random sample of 50 fully grown lizards from this remote
location. The mean of this random sample is 14.02 cm. You may assume that the variance of the
length of lizards on the remote island is 3.42 cm2.
(a) Test, at the 5% significance level, whether the fully grown lizards in this location have a
mean length which is different from 13.2 cm. [7]
(b) Now suppose it is not known that the lengths are normally distributed.
(i) Explain why the Central Limit Theorem can be used in this context. [1]
(ii) State where in your test the Central Limit Theorem would be used. [1]
4 In this question you must show the parameters of any distributions you use.
The continuous random variable V has the distribution N(42, 32).
The continuous random variable W has the distribution N(48, 42).
The random variable X is the sum of 5 independent observations of V.
The random variable Y is the sum of 7 independent observations of W.
(a) Determine P(X + Y 2 560). [3]
(b) Determine the probability that X is less than 60% of Y. [4]
© OCR 2025 Y542/01 Jun25 Turn over
, 4
5 For many years a coach company has used a make of tyre that has an average driving lifespan
of 1.52 # 105 km. The coach company decides to fit a new make of tyre to 12 of its coaches,
and records the lifespan of one of the tyres, randomly chosen, for each of these 12 coaches. The
distances, in multiples of 105 km, are given below.
1.35 1.46 1.48 1.53 1.54 1.57
1.62 1.74 1.76 1.82 1.88 1.91
The coach company wishes to test whether the new make of tyres has improved the driving
lifespan.
(a) Explain why a hypothesis test based on a normal distribution may not be valid. [1]
(b) Carry out a suitable Wilcoxon test at the 5% significance level. [7]
(c) Explain why a Wilcoxon test, if it is valid, is preferable to a sign test in this context. [1]
6 The editor of a mathematical journal investigated whether there was association between the types
of articles published in the journal and the academic backgrounds of the authors.
The results for a random sample of 64 articles are shown in the table.
Pure maths Applied maths Other
Schools and colleges 6 4 5
Universities 30 12 7
The editor carries out a test at the 10% significance level.
(a) Explain why it is not possible to combine rows of the table before carrying out the test. [1]
(b) Show that it is necessary to combine columns before carrying out the test. [2]
(c) Carry out the test. [6]
© OCR 2025 Y542/01 Jun25
Statistics. All Assessment Questions & Mark Scheme [OCR Y542/01]
Exam Resource Summary
The A Level Further Mathematics A June 2025 Paper Y542/01: Statistics (OCR) – All
Assessment Questions & Mark Scheme document integrates the complete official examination
paper with its full mark scheme, offering a comprehensive and practical revision tool. This paper
assesses students’ mastery of advanced statistical concepts and techniques, including
probability distributions, hypothesis testing, correlation and regression, estimation, and the
analysis of variance (ANOVA). It requires students to apply statistical methods to interpret
data, justify conclusions, and critically evaluate models in real-world contexts. The merged
format presents each question alongside its marking criteria, providing insight into examiner
expectations, mark allocation, and effective solution structure. This resource is essential for
focused revision, self-assessment, and enhancing analytical and data interpretation skills, making
it a key tool for preparation for the May 2026 OCR A Level Further Mathematics A Paper
Y542/01: Statistics examination.
Turn over
, 2
1 A set of 16 observations of the bivariate data (X, Y ) are summarised as follows.
n = 16 / x = 136 / y = 352 / x2 = 1496 / y2 = 9104 / xy = 3642
Determine an estimate of the value of y corresponding to x = 8.5. [4]
2 The number of trees of a particular species found in 1km2 of a forest can be modelled by the
distribution Po(m).
The forest consists of two regions, A and B.
In the region A, m = 4. The number of trees of this species in a randomly chosen area of 3km2 in
region A is denoted by X.
(a) Find P(16 1 X 1 20). [3]
In region B, m = 8. The number of trees of this species in a randomly chosen area of 3km2 in
region B is denoted by Y.
The random variable Z is defined by Z = X + Y . It may be assumed that X and Y are independent.
(b) Write down a formula for P(Z = z), in terms of z. [2]
(c) The average numbers of trees of this species in one square kilometre are not the same in
regions A and B.
Explain why the associated modelling assumption for the distribution of Z is nevertheless
valid. [1]
(d) Show that Y - X does not have a Poisson distribution. [1]
© OCR 2025 Y542/01 Jun25
, 3
3 The length, in cm, of sand lizards when fully grown is a random variable which is known to have
the distribution N(13.2, 3.42).
Some scientists discover a colony of what they believe to be sand lizards in a remote location.
The scientists measure the lengths of a random sample of 50 fully grown lizards from this remote
location. The mean of this random sample is 14.02 cm. You may assume that the variance of the
length of lizards on the remote island is 3.42 cm2.
(a) Test, at the 5% significance level, whether the fully grown lizards in this location have a
mean length which is different from 13.2 cm. [7]
(b) Now suppose it is not known that the lengths are normally distributed.
(i) Explain why the Central Limit Theorem can be used in this context. [1]
(ii) State where in your test the Central Limit Theorem would be used. [1]
4 In this question you must show the parameters of any distributions you use.
The continuous random variable V has the distribution N(42, 32).
The continuous random variable W has the distribution N(48, 42).
The random variable X is the sum of 5 independent observations of V.
The random variable Y is the sum of 7 independent observations of W.
(a) Determine P(X + Y 2 560). [3]
(b) Determine the probability that X is less than 60% of Y. [4]
© OCR 2025 Y542/01 Jun25 Turn over
, 4
5 For many years a coach company has used a make of tyre that has an average driving lifespan
of 1.52 # 105 km. The coach company decides to fit a new make of tyre to 12 of its coaches,
and records the lifespan of one of the tyres, randomly chosen, for each of these 12 coaches. The
distances, in multiples of 105 km, are given below.
1.35 1.46 1.48 1.53 1.54 1.57
1.62 1.74 1.76 1.82 1.88 1.91
The coach company wishes to test whether the new make of tyres has improved the driving
lifespan.
(a) Explain why a hypothesis test based on a normal distribution may not be valid. [1]
(b) Carry out a suitable Wilcoxon test at the 5% significance level. [7]
(c) Explain why a Wilcoxon test, if it is valid, is preferable to a sign test in this context. [1]
6 The editor of a mathematical journal investigated whether there was association between the types
of articles published in the journal and the academic backgrounds of the authors.
The results for a random sample of 64 articles are shown in the table.
Pure maths Applied maths Other
Schools and colleges 6 4 5
Universities 30 12 7
The editor carries out a test at the 10% significance level.
(a) Explain why it is not possible to combine rows of the table before carrying out the test. [1]
(b) Show that it is necessary to combine columns before carrying out the test. [2]
(c) Carry out the test. [6]
© OCR 2025 Y542/01 Jun25