

⬣
Class Scores
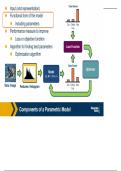
Input (and representation)
⬣ Functional form of the model
⬣ Including parameters Car Coffee Bird
Cup
⬣ Performance measure to improve
⬣ Loss or objective function
⬣ Algorithm for finding best parameters Loss Function
⬣ Optimization algorithm
Class Scores
Optimizer
Model
" #, % = %# + (
Data: Image Car Coffee Bird
Features: Histogram Cup
Components of a Parametric Model
, ! ", $ = &
Classifier Output
Input Weights (scalar or vector)
(vector)
⬣ Input: Continuous number or vector
⬣ Output: A continuous number
⬣ For classification typically a score
⬣ For regression what we want to regress to (house prices,
crime rate, etc.)
⬣ + is a vector and weights to optimize to fit target function
Model: Discriminative Parameterized Function
,What is the simplest function
you can think of?
Our model is:
! = #$ + &
+
=
+ ! ", $ = $ ⋅ " + )
−
%
+ 1 %+2
5 += 2
Weights Bias
Classifier
(scalar)
Result
%
Input
(Note if ! and " are column vectors we often show this as !! #)
Image adapted from:
https://en.wikipedia.org/wiki/Linear_equation#/
media/File:Linear_Function_Graph.svg
Simple Function
,Linear Classification and
Regression
Simple linear classifier:
⬣ Calculate score:
, -, + = + ⋅ - + 1
⬣ Binary classification rule
(+ is a vector):
B 56 , -, + > = 8
@=A
8 9:;<=>5?<
⬣ For multi-class classifier take
class with highest (max) score
,(-, 3) = 3- + 1
,⬣ Idea: Separate classes via
Car
high-dimensional linear
separators (hyper-planes) Bird
⬣ One of the simplest
parametric models, but
surprisingly effective
⬣ Very commonly used!
⬣ Let’s look more closely at
each element
Linear Classification and Regression
, Data: Image Class Scores
Model
> -, ? = ?- + @
Car Coffee Bird
+"" Cup
+"#
⋮
+"" +"# ⋯ +"'
+#"
+#" +## ⋯ +#'
+= ⋮ ⋮ ⋱ ⋮ + = +##
⋮
+'" +'# ⋯ +'' Flatten
+'"
⋮
+''
To simplify notation we will refer to inputs as '! ⋯ '0 where C = D × D
Input Dimensionality
, Model
( $, ' = '$ + &
Classifier for class 1 *!! *!" ⋯ *!# ,! .!
Classifier for class 2 *"! *"" ⋯ *"# ," ."
Classifier for class 3 *$! *$" ⋯ *$# ⋮ + .$
,#
' $ &
(Note that in practice, implementations can use xW instead, assuming a different shape for W. That is just a different convention and is equivalent.)
Weights
,⬣ We can move Model
the bias term ( $, ' = '$ + &
into the weight
matrix, and a “1”
at the end of the *!! *!" ⋯ *!# .! ,!
input *"! *"" ⋯ *"# ." ,"
*$! *$" ⋯ *$# .$ ⋮
⬣ Results in one ,#
matrix-vector 1
multiplication! ' $
Weights
, Example with an image with 4 pixels, and 3 classes (cat/dog/ship)
Stretch pixels into column
56
0.2 -0.5 0.1 2.0 1.1 -96.8 Cat score
56 231
231
24 2
1.5 1.3 2.1 0.0 + 3.2 = 437.9 Dog score
24
0 0.25 0.2 -0.3 -1.2 60.75 Ship score
Input image
2
' &
Adapted from slides by Fei-Fei Li, Justin Johnson, Serena Yeung, from CS 231n
Example
Class Scores
Input (and representation)
⬣ Functional form of the model
⬣ Including parameters Car Coffee Bird
Cup
⬣ Performance measure to improve
⬣ Loss or objective function
⬣ Algorithm for finding best parameters Loss Function
⬣ Optimization algorithm
Class Scores
Optimizer
Model
" #, % = %# + (
Data: Image Car Coffee Bird
Features: Histogram Cup
Components of a Parametric Model
, ! ", $ = &
Classifier Output
Input Weights (scalar or vector)
(vector)
⬣ Input: Continuous number or vector
⬣ Output: A continuous number
⬣ For classification typically a score
⬣ For regression what we want to regress to (house prices,
crime rate, etc.)
⬣ + is a vector and weights to optimize to fit target function
Model: Discriminative Parameterized Function
,What is the simplest function
you can think of?
Our model is:
! = #$ + &
+
=
+ ! ", $ = $ ⋅ " + )
−
%
+ 1 %+2
5 += 2
Weights Bias
Classifier
(scalar)
Result
%
Input
(Note if ! and " are column vectors we often show this as !! #)
Image adapted from:
https://en.wikipedia.org/wiki/Linear_equation#/
media/File:Linear_Function_Graph.svg
Simple Function
,Linear Classification and
Regression
Simple linear classifier:
⬣ Calculate score:
, -, + = + ⋅ - + 1
⬣ Binary classification rule
(+ is a vector):
B 56 , -, + > = 8
@=A
8 9:;<=>5?<
⬣ For multi-class classifier take
class with highest (max) score
,(-, 3) = 3- + 1
,⬣ Idea: Separate classes via
Car
high-dimensional linear
separators (hyper-planes) Bird
⬣ One of the simplest
parametric models, but
surprisingly effective
⬣ Very commonly used!
⬣ Let’s look more closely at
each element
Linear Classification and Regression
, Data: Image Class Scores
Model
> -, ? = ?- + @
Car Coffee Bird
+"" Cup
+"#
⋮
+"" +"# ⋯ +"'
+#"
+#" +## ⋯ +#'
+= ⋮ ⋮ ⋱ ⋮ + = +##
⋮
+'" +'# ⋯ +'' Flatten
+'"
⋮
+''
To simplify notation we will refer to inputs as '! ⋯ '0 where C = D × D
Input Dimensionality
, Model
( $, ' = '$ + &
Classifier for class 1 *!! *!" ⋯ *!# ,! .!
Classifier for class 2 *"! *"" ⋯ *"# ," ."
Classifier for class 3 *$! *$" ⋯ *$# ⋮ + .$
,#
' $ &
(Note that in practice, implementations can use xW instead, assuming a different shape for W. That is just a different convention and is equivalent.)
Weights
,⬣ We can move Model
the bias term ( $, ' = '$ + &
into the weight
matrix, and a “1”
at the end of the *!! *!" ⋯ *!# .! ,!
input *"! *"" ⋯ *"# ." ,"
*$! *$" ⋯ *$# .$ ⋮
⬣ Results in one ,#
matrix-vector 1
multiplication! ' $
Weights
, Example with an image with 4 pixels, and 3 classes (cat/dog/ship)
Stretch pixels into column
56
0.2 -0.5 0.1 2.0 1.1 -96.8 Cat score
56 231
231
24 2
1.5 1.3 2.1 0.0 + 3.2 = 437.9 Dog score
24
0 0.25 0.2 -0.3 -1.2 60.75 Ship score
Input image
2
' &
Adapted from slides by Fei-Fei Li, Justin Johnson, Serena Yeung, from CS 231n
Example


