
1
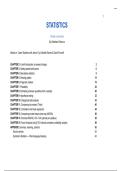
STATISTICS
Chapter summaries
By Seldzhan Raimova
Based on “Learn Statistics with Jamovi” by Danielle Navaro & David Foxcroft
CHAPTER 2: A brief introduction to research design 2
CHAPTER 3: Getting started with jamovi 6
CHAPTER 4: Descriptive statistics 9
CHAPTER 5: Drawing graphs 14
CHAPTER 6: Pragmatic matters 19
CHAPTER 7: Probability 24
CHAPTER 8: Estimating unknown quantities from a sample 28
CHAPTER 9: Hypothesis testing 32
CHAPTER 10: Categorical data analysis 35
CHAPTER 11: Comparing two means (T-test) 40
CHAPTER 12: Correlation and linear regression 44
CHAPTER 13: Comparing several means (one-way ANOVA) 49
CHAPTER 14: Factorial ANOVA (14.5–14.6 optional per syllabus) 54
CHAPTER 15: Factor Analysis (only §15.5 Internal consistency reliability analysis 59
APPENDIX: Summary, meaning, symbols 63
Good overview 63
Symbols & Notation — Plain‑language Glossary 64
, 2
CHAPTER 2: A brief introduction to research design
Construct → Measure → Operationalisation → Variable → Design → Reliability → Validity → (then) Statistics.
Core concepts
● Theoretical construct: thing you want to know (e.g., “anxiety”). Not directly observable.
● Measure: the tool/procedure producing observation23s (question item, behaviour code, RT).
● Operationalisation: the logic that connects construct → measure (how your item/RT “stands for” anxiety). Case-by-case;
no single best way.
● Variable: the data after you apply the measure (what’s in your dataset).
● Predictor / Outcome (IV/DV): variables by role in explanation: 𝑋 explains, 𝑌 is explained (notation below). Authors prefer
“predictor/outcome” over IV/DV.
Scales of measurement (what maths “makes sense”)
● Nominal (categorical): labels only; no ordering; don’t average (“average eye color” is nonsense).
e.g., transport type
● Ordinal: ordered ranks; gaps not equal.
, 3
e.g., “agree…disagree”
● Interval: equal steps; no true zero.
e.g., °C. Add/subtract okay; ratios not meaningful.
● Ratio: equal steps + true zero.
e.g., response time (RT). All arithmetic valid, including ratios.
Continuous vs discrete: nominal/ordinal are always discrete; interval/ratio can be either (e.g., °C continuous; year = discrete).
Likert twist (the messy real world): strictly ordinal, but many treat 5- or 7-point Likert as quasi-interval in practice (participants act
as if steps are roughly equal). Know the nuance and justify your choice.
Reliability (precision/consistency of a measure)
Reliable = repeatable; valid = correct. You can be reliable but wrong (bathroom scale with potatoes). Reliability is necessary but
not sufficient for validity.
Types you should name and recognise:
● Test–retest (over time).
● Inter-rater (between coders).
● Parallel forms (equivalent versions).
● Internal consistency (items agree—covered in Ch 15.5; think α/ω).
When is low internal consistency okay? When a composite intentionally mixes distinct skills/components (the whole isn’t one
, 4
narrow thing).
Validity (can we trust the conclusion?)
● Internal validity: correct causal story inside the study? (Confounds break this.)
● External validity: will it generalise to other people/tasks/settings/measures? (Not just “students ≠ world”; relevance
matters.)
● Construct validity: does your measure really tap the construct? (e.g., “stand up if you’ve cheated” measures something
else.)
● Face validity: looks right on the surface (scientifically weak, politically useful).
● Ecological validity: lab set-up resembles the real situation (often used as a proxy for external validity, but no guarantee).
Classic threats (know & spot them):
● Selection bias (groups differ at baseline).
● Attrition:
○ Homogeneous → harms external validity.
○ Differential (heterogeneous) → creates confounds; kills internal validity.
● Non-response bias (survey responders differ from non-responders; also item non-response).
● Regression to the mean (extremes drift toward average on re-test; fakes “feedback effects”).
● Experimenter bias (unknowingly cuing participants; “Clever Hans”).
● Demand characteristics (good/negative/faithful/apprehensive participant roles).
STATISTICS
Chapter summaries
By Seldzhan Raimova
Based on “Learn Statistics with Jamovi” by Danielle Navaro & David Foxcroft
CHAPTER 2: A brief introduction to research design 2
CHAPTER 3: Getting started with jamovi 6
CHAPTER 4: Descriptive statistics 9
CHAPTER 5: Drawing graphs 14
CHAPTER 6: Pragmatic matters 19
CHAPTER 7: Probability 24
CHAPTER 8: Estimating unknown quantities from a sample 28
CHAPTER 9: Hypothesis testing 32
CHAPTER 10: Categorical data analysis 35
CHAPTER 11: Comparing two means (T-test) 40
CHAPTER 12: Correlation and linear regression 44
CHAPTER 13: Comparing several means (one-way ANOVA) 49
CHAPTER 14: Factorial ANOVA (14.5–14.6 optional per syllabus) 54
CHAPTER 15: Factor Analysis (only §15.5 Internal consistency reliability analysis 59
APPENDIX: Summary, meaning, symbols 63
Good overview 63
Symbols & Notation — Plain‑language Glossary 64
, 2
CHAPTER 2: A brief introduction to research design
Construct → Measure → Operationalisation → Variable → Design → Reliability → Validity → (then) Statistics.
Core concepts
● Theoretical construct: thing you want to know (e.g., “anxiety”). Not directly observable.
● Measure: the tool/procedure producing observation23s (question item, behaviour code, RT).
● Operationalisation: the logic that connects construct → measure (how your item/RT “stands for” anxiety). Case-by-case;
no single best way.
● Variable: the data after you apply the measure (what’s in your dataset).
● Predictor / Outcome (IV/DV): variables by role in explanation: 𝑋 explains, 𝑌 is explained (notation below). Authors prefer
“predictor/outcome” over IV/DV.
Scales of measurement (what maths “makes sense”)
● Nominal (categorical): labels only; no ordering; don’t average (“average eye color” is nonsense).
e.g., transport type
● Ordinal: ordered ranks; gaps not equal.
, 3
e.g., “agree…disagree”
● Interval: equal steps; no true zero.
e.g., °C. Add/subtract okay; ratios not meaningful.
● Ratio: equal steps + true zero.
e.g., response time (RT). All arithmetic valid, including ratios.
Continuous vs discrete: nominal/ordinal are always discrete; interval/ratio can be either (e.g., °C continuous; year = discrete).
Likert twist (the messy real world): strictly ordinal, but many treat 5- or 7-point Likert as quasi-interval in practice (participants act
as if steps are roughly equal). Know the nuance and justify your choice.
Reliability (precision/consistency of a measure)
Reliable = repeatable; valid = correct. You can be reliable but wrong (bathroom scale with potatoes). Reliability is necessary but
not sufficient for validity.
Types you should name and recognise:
● Test–retest (over time).
● Inter-rater (between coders).
● Parallel forms (equivalent versions).
● Internal consistency (items agree—covered in Ch 15.5; think α/ω).
When is low internal consistency okay? When a composite intentionally mixes distinct skills/components (the whole isn’t one
, 4
narrow thing).
Validity (can we trust the conclusion?)
● Internal validity: correct causal story inside the study? (Confounds break this.)
● External validity: will it generalise to other people/tasks/settings/measures? (Not just “students ≠ world”; relevance
matters.)
● Construct validity: does your measure really tap the construct? (e.g., “stand up if you’ve cheated” measures something
else.)
● Face validity: looks right on the surface (scientifically weak, politically useful).
● Ecological validity: lab set-up resembles the real situation (often used as a proxy for external validity, but no guarantee).
Classic threats (know & spot them):
● Selection bias (groups differ at baseline).
● Attrition:
○ Homogeneous → harms external validity.
○ Differential (heterogeneous) → creates confounds; kills internal validity.
● Non-response bias (survey responders differ from non-responders; also item non-response).
● Regression to the mean (extremes drift toward average on re-test; fakes “feedback effects”).
● Experimenter bias (unknowingly cuing participants; “Clever Hans”).
● Demand characteristics (good/negative/faithful/apprehensive participant roles).


