lOMoAR cPSD| 57819357
CDDDDDDDDSAS
ECG INTERPRETATION CHEAT SHEET 2025-2026
EEEEEER eeeElOM oARc PSD| 57819357
WHAT EXACTLY IS AN ECG?
An ECG (or EKG) – which stands for electrocardiogram – looks at an electrical tracing of the
cardiac activity within your heart. Changes can indicate structural, mechanical, or electrical
issues. The electrical tracing is referred to as a rhythm strip. Depending on the number of
electrodes, this gives various different leads or views of the heart.
The most common ECG is a 12-lead ECG, which utilizes 10 electrodes to get 12 different views of
the heart. However, continuous telemetry monitoring usually utilizes 3-5 electrodes, viewing only a
few important leads, with a primary lead (usually Lead II) being continuously monitored.
Interpreting a 12-lead ECG is advanced – primarily falling on the responsibility of the physician or
advanced practice provider (APP). However, interpreting rhythm strips (in a single lead) is super
important for every inpatient nurse to know – especially those working in the ED, ICU,
Telemetry, or Cardiac units.
, lOMoAR cPSD| 57819357
THE RHYTHM STRIP
A rhythm strip is made up of 6-seconds, split into two separate 3-second portions (marked by
black marks above strip). You will have to analyze and document readings every so often (usually
every 8 hours) – especially if you are on a telemetry floor. If you work in the ED, you will have
to do this initially on all those patients who it is required, writing your interpretation and any
abnormalities. In critical situations, you will need to analyze a rhythm directly from the
monitor or the defibrillator.
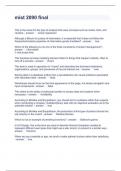
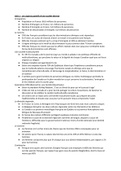
The P-QRS-T complex is each heartbeat
broken down into an electrical tracing. The
Pwave occurs during atrial depolarization,
which causes the atria to contract. The QRS
complex signifies ventricular depolarization -
when the ventricles contract. Finally, the
Twave is when the ventricles repolarize –
meaning the ventricular cells are electrically
recharging for another contraction. There is no
atrial repolarization seen because this is much
smaller and is hidden within the QRS complex.
Remember the rhythm tracing indicates electrical impulses through the heart cells. Just
because the electrical impulse is there does not mean the heart will have the mechanical
response (i.e. contraction). This is the case during PEA.
, lOMoAR cPSD| 57819357
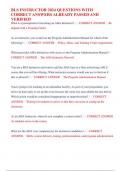
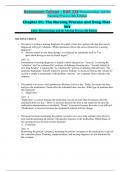
While interpreting a rhythm strip, the graph paper boxes are
there so you can easily compare and measure various parts of
the tracing. The PR interval represents the amount of time it
takes for the electrical impulse to go from the SA node in the
atria, until it reaches the ventricles. This comes in handy when
determining heart blocks, as blocks will slow conduction of the
electrical impulse. Although it is called the PR interval, it actually
is the length between the beginning of the P-wave and the
beginning of the Q wave. The normal PR interval is 120-200
ms, or 3-5 small boxes. PR intervals that are consistent but
longer than 200 ms indicates a 1st degree heart block.
The QRS complex width represents how long the electrical
impulse takes to depolarize the entire left and right ventricles.
Normally, the QRS complex is narrow 80-100 ms (2-2.5 small boxes). If this is widened, it
indicates some type of bundle branch block – which is a delay of the conduction between the
ventricles.
The QT interval is the length of time it takes the electrical impulse to go from the beginning
of the ventricles – until the ventricles completely repolarize and are ready for another
contraction. This should be between 350-450 ms. If this is elongated – this presents an
increased risk of various arrhythmias such as Torsades or Vfib, especially if > 500 ms.
However, if the heart rate is abnormally slow (bradycardia) or fast (tachycardia), this will not be
accurately reflected. Due to this, the QT-c (QT-corrected) is usually used which corrects for
the heart rate.
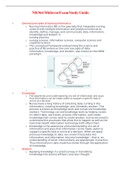
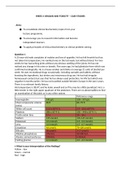
The ST-segment indicates the beginning of ventricular recovery. The
point between the QRS complex and where the ST-segment begins is
called the J-point. The ST-segment can either be normal (at the
isoelectric line), elevated, or depressed. The ST segment should be at
the isoelectric line at baseline, measured by the TP segment. ST
elevation or depression in at least 2 contiguous leads is likely to indicate
cardiac ischemia or infarction.
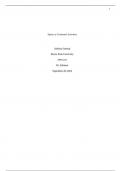
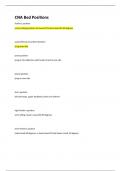
ST depression is defined as greater than 0.5mm (1/2 small box) below the isoelectric line. This
usually indicates cardiac ischemia – meaning there is a lack of perfusion to some area of the
heart. It can also indicate digoxin toxicity or electrolyte abnormalities. ST depression can
either be upsloping, down-sloping, or horizontal – with down-sloping being more specific
for myocardial ischemia.
CDDDDDDDDSAS
ECG INTERPRETATION CHEAT SHEET 2025-2026
EEEEEER eeeElOM oARc PSD| 57819357
WHAT EXACTLY IS AN ECG?
An ECG (or EKG) – which stands for electrocardiogram – looks at an electrical tracing of the
cardiac activity within your heart. Changes can indicate structural, mechanical, or electrical
issues. The electrical tracing is referred to as a rhythm strip. Depending on the number of
electrodes, this gives various different leads or views of the heart.
The most common ECG is a 12-lead ECG, which utilizes 10 electrodes to get 12 different views of
the heart. However, continuous telemetry monitoring usually utilizes 3-5 electrodes, viewing only a
few important leads, with a primary lead (usually Lead II) being continuously monitored.
Interpreting a 12-lead ECG is advanced – primarily falling on the responsibility of the physician or
advanced practice provider (APP). However, interpreting rhythm strips (in a single lead) is super
important for every inpatient nurse to know – especially those working in the ED, ICU,
Telemetry, or Cardiac units.
, lOMoAR cPSD| 57819357
THE RHYTHM STRIP
A rhythm strip is made up of 6-seconds, split into two separate 3-second portions (marked by
black marks above strip). You will have to analyze and document readings every so often (usually
every 8 hours) – especially if you are on a telemetry floor. If you work in the ED, you will have
to do this initially on all those patients who it is required, writing your interpretation and any
abnormalities. In critical situations, you will need to analyze a rhythm directly from the
monitor or the defibrillator.
The P-QRS-T complex is each heartbeat
broken down into an electrical tracing. The
Pwave occurs during atrial depolarization,
which causes the atria to contract. The QRS
complex signifies ventricular depolarization -
when the ventricles contract. Finally, the
Twave is when the ventricles repolarize –
meaning the ventricular cells are electrically
recharging for another contraction. There is no
atrial repolarization seen because this is much
smaller and is hidden within the QRS complex.
Remember the rhythm tracing indicates electrical impulses through the heart cells. Just
because the electrical impulse is there does not mean the heart will have the mechanical
response (i.e. contraction). This is the case during PEA.
, lOMoAR cPSD| 57819357
While interpreting a rhythm strip, the graph paper boxes are
there so you can easily compare and measure various parts of
the tracing. The PR interval represents the amount of time it
takes for the electrical impulse to go from the SA node in the
atria, until it reaches the ventricles. This comes in handy when
determining heart blocks, as blocks will slow conduction of the
electrical impulse. Although it is called the PR interval, it actually
is the length between the beginning of the P-wave and the
beginning of the Q wave. The normal PR interval is 120-200
ms, or 3-5 small boxes. PR intervals that are consistent but
longer than 200 ms indicates a 1st degree heart block.
The QRS complex width represents how long the electrical
impulse takes to depolarize the entire left and right ventricles.
Normally, the QRS complex is narrow 80-100 ms (2-2.5 small boxes). If this is widened, it
indicates some type of bundle branch block – which is a delay of the conduction between the
ventricles.
The QT interval is the length of time it takes the electrical impulse to go from the beginning
of the ventricles – until the ventricles completely repolarize and are ready for another
contraction. This should be between 350-450 ms. If this is elongated – this presents an
increased risk of various arrhythmias such as Torsades or Vfib, especially if > 500 ms.
However, if the heart rate is abnormally slow (bradycardia) or fast (tachycardia), this will not be
accurately reflected. Due to this, the QT-c (QT-corrected) is usually used which corrects for
the heart rate.
The ST-segment indicates the beginning of ventricular recovery. The
point between the QRS complex and where the ST-segment begins is
called the J-point. The ST-segment can either be normal (at the
isoelectric line), elevated, or depressed. The ST segment should be at
the isoelectric line at baseline, measured by the TP segment. ST
elevation or depression in at least 2 contiguous leads is likely to indicate
cardiac ischemia or infarction.
ST depression is defined as greater than 0.5mm (1/2 small box) below the isoelectric line. This
usually indicates cardiac ischemia – meaning there is a lack of perfusion to some area of the
heart. It can also indicate digoxin toxicity or electrolyte abnormalities. ST depression can
either be upsloping, down-sloping, or horizontal – with down-sloping being more specific
for myocardial ischemia.