Explains quantitative sales forecasting and why a business would construct a sales forecast. Also explains moving averages, variations from trends, forecasting using extrapolation, scatter graphs and limits of sales forecasting
Theme 3 Topic 6
Quantitative Sales Forecasting
Quantitative Sales Forecasting
Sales forecasting – estimating the likely revenues of a product over a future period.
Why do businesses construct a sales forecast?
Identify stage in product lifecycle
Makes cash flow forecast more accurate
Supports achievement of sales maximisation, increase efficiency
Budgets
Predict stock requirements/staff levels
Make decisions on growth/expand/retrench
Moving Averages (Time-Series Analysis)
Moving averages – looks at data over a period of time and averages out the data. Identifies underlying trends
by smoothing out data which is seasonal or erratic.
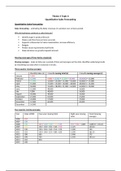
Three quarter moving averages:
Monthly Sales (£) 3 month moving total (£) 3 month moving average (£)
January 9,000
February 12,000 9,000 + 12,000 + 15,000 = 36,000 36,000/3 = 12,000
March 15,000 12,000 + 15,000 + 15,000 = 42,000 42,000/3 = 14,000
April 15,000 15,000 + 15,000 + 18,000 = 48,000 48,000/3 = 16,000
May 18,000 15,000 + 18,000 + 21,000 = 54,000 54,000/3 = 18,000
June 21,000 48,000 16,000
July 9,000 48,000 16,000
August 18,000 48,000 16,000
September 21,000 63,000 21,000
October 24,000 57,000 19,000
November 12,000 60,000 20,000
December 24,000
Stuvia customers have reviewed more than 700,000 summaries. This how you know that you are buying the best documents.
Quick and easy check-out
You can quickly pay through credit card or Stuvia-credit for the summaries. There is no membership needed.
Focus on what matters
Your fellow students write the study notes themselves, which is why the documents are always reliable and up-to-date. This ensures you quickly get to the core!
Frequently asked questions
What do I get when I buy this document?
You get a PDF, available immediately after your purchase. The purchased document is accessible anytime, anywhere and indefinitely through your profile.
Satisfaction guarantee: how does it work?
Our satisfaction guarantee ensures that you always find a study document that suits you well. You fill out a form, and our customer service team takes care of the rest.
Who am I buying these notes from?
Stuvia is a marketplace, so you are not buying this document from us, but from seller emily1744. Stuvia facilitates payment to the seller.
Will I be stuck with a subscription?
No, you only buy these notes for $4.79. You're not tied to anything after your purchase.