
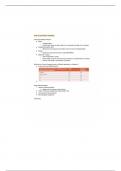
Interval and Ratio Variables:
Interval and Ratio Analysis:
● Mean
○ Average Value
○ Useful when there are few outliers (i.e. extremely too high or low values)
● Standard Deviation (SD)
○ Measures how spread out the data is from its mean (standardized)
● Range
○ Maximum value and minimum value (MIN/MAX)
● Mean/SD - Output
○ See full example in notes
○ Ratio- Need to report min/max since numbers can range from 0 to infinity
○ Interval- the range is sometimes not shown.
What to do if interval questions are in different questions in Qualtrics?
● Create your own table by hand:
●
Open-Ended Analysis:
1. Iterative reading analysis
a. Read over the answer several times
2. Think of themes (categories) to group them into
3. Code answers by responses
4. Re-arrange by categories
Clustering:


