
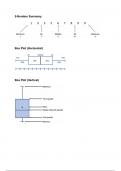
5-Number Summary
Box Plot (Horizontal)
Box Plot (Vertical)
, Skewness & Box Plots
Histograms & Box Plots
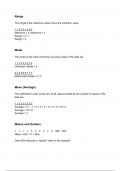
Box Plot (Horizontal)
Box Plot (Vertical)
, Skewness & Box Plots
Histograms & Box Plots
Construct a box plot to visualize the 5-number of summary of a data set. Match a frequency distribution to a corresponding box plot. Calculate the upper and lower fences for outliers using the interquartile range. Identify outliers using the interquartile range method.


Quality you can trust: written by students who passed their tests and reviewed by others who've used these notes.
No worries! You can instantly pick a different document that better fits what you're looking for.
No subscription, no commitments. Pay the way you're used to via credit card and download your PDF document instantly.

“Bought, downloaded, and aced it. It really can be that simple.”