BBS2007 Statistics Summary
This exam will be 25 multiple choice questions and 5 open questions. This summary is long because it’s
for dumbasses like myself who hate statistics. I will not presume you know anything, because I myself
know nothing. Insert obligatory comparison to Jon Snow.
There was a syllabus of BBS2007. All points from the syllabus will be displayed like this:
- Given a research question and collected data you should know which statistical models are
applicable.
This course was on linear regression, logistic regression and mixed model analysis. If you do not know
what any of those words mean, I suggest scrolling to where I say BBS1003 recap, because you need to
be calculating a simple confidence interval in your sleep before you do this stuff.
The main thing you need to know for this exam is when to use each type of regression.
If you have a continuous dependent variable → Linear regression
- How long will Nile nap for if she is X% sleep deprived
If you have a binary dependent variable → Logistic regression (categorical etc)
- Nile had 3 hours sleep. Look at the probability that she snorts cocaine to get through the day
has an afternoon nap. Yes = 1, No = 0
If you have several correlated measures as a dependent variable → Repeated measures/ mixed model
analysis
- I don’t have a good Nile x Sleep Deprivation example for this
- You have participants play a game on three difficulty levels and look for a statistical
difference between their score on the games. This is because they are correlated-
someone who is good at video games will have a high score on game 1, and probably a
high score on game 2 and 3. There is correlation within the results that should not be
discounted.
Linear Regression
This is based on lecture 1, which is on linear regression, particularly ANOVA. We have a study, we will
make a regression line (like a fancy line of best fit that you use for predictions), and then we will add
more and more variables into the equation to try and explain more of the variance between results.
First, let’s explain what Linear Regression is simply, using our notes from BBS1003.
Linear regression looks at the correlation and continuation of a relationship between a dependant and
independent variable. You’re basically predicting Y using X, so we are looking for the best fitting line
1
,between all of the scores of the variables- essentially the best “line of best fit” for a scatter plot. It has
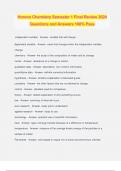
this formula
, which is essentially the same as the normal Y=mx+c for a linear line.
Y is the dependent variable (it’s value is literally dependent on the rest of the equation), X is the
independent variable. E is the error value.
B0 is the Y- intercept and B1 is the slope. When we don’t know the exact values, we estimate, and we
mark that its an estimate by giving the B a hat.
Capital B is for the population and lower case b, or B^ is for the sample. I will stick to using b1 and b0.
For the population the error is the curly capital E; for the sample, its a normal “e”.
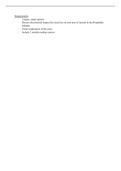
When you have the equation of the line itself, there is no e value. Therefore it is written as
. This is where the mean of Y (for a given X value) is equal to the equation of the line,
because that point is on the line.
Thus, when X is 0, Y is equal only to b0, which is thus the Y intercept and also the mean of Y when X is
equal to 0.
If X were to increase by 1, then the mean of Y given X changes by b1. Or, in other words, b1 is the change
in the mean of Y for a 1 unit change in X.
It follows on that if X increases by 3, Y increases by 3*b1.
Finding b1 and b0
Ok, now lets move onto BBS2007 stuff. Anything in red is a line from the syllabus.
Some of will look really shitty, but I promise you it’s ok. If you’re confused, the lecture is only 55
minutes and I found it pretty easy to grasp with Prof Ambergen explaining it.
We will explain linear regression using the results from a study into whether eating meat or eating fish
had any effect on how long you would bleed for after having a small cut on the arm. There were 84
2
,participants, split into a group of fish eaters (n=42) and meat eaters (n=42). Their bleeding time (bt) was
measured twice- before the study (bt0) and after 6 weeks of a fish or meat diet (bt6).
Ho = No difference between bt6 of fish group and meat group
Ha = Difference between bt6 of fish group and meat group.
This study was conducted as a partnership between three locations- Maastricht, Tromso and Zeist. The
locations were given codes so that they could be referred back to later.
Maastricht = 4
Tromso =5
Zeist =6
The fish and meat groups were also given codes. Fish =1, Meat =0.
All of the information I have just said is important! It will come back later!! Coding your variables makes
a big difference, plz remember it.
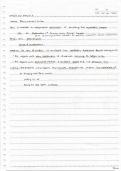
This means that the results initially look something a bit like this. Very dull, basic ass information, just
the people who did the study etc.
3
, 4
This exam will be 25 multiple choice questions and 5 open questions. This summary is long because it’s
for dumbasses like myself who hate statistics. I will not presume you know anything, because I myself
know nothing. Insert obligatory comparison to Jon Snow.
There was a syllabus of BBS2007. All points from the syllabus will be displayed like this:
- Given a research question and collected data you should know which statistical models are
applicable.
This course was on linear regression, logistic regression and mixed model analysis. If you do not know
what any of those words mean, I suggest scrolling to where I say BBS1003 recap, because you need to
be calculating a simple confidence interval in your sleep before you do this stuff.
The main thing you need to know for this exam is when to use each type of regression.
If you have a continuous dependent variable → Linear regression
- How long will Nile nap for if she is X% sleep deprived
If you have a binary dependent variable → Logistic regression (categorical etc)
- Nile had 3 hours sleep. Look at the probability that she snorts cocaine to get through the day
has an afternoon nap. Yes = 1, No = 0
If you have several correlated measures as a dependent variable → Repeated measures/ mixed model
analysis
- I don’t have a good Nile x Sleep Deprivation example for this
- You have participants play a game on three difficulty levels and look for a statistical
difference between their score on the games. This is because they are correlated-
someone who is good at video games will have a high score on game 1, and probably a
high score on game 2 and 3. There is correlation within the results that should not be
discounted.
Linear Regression
This is based on lecture 1, which is on linear regression, particularly ANOVA. We have a study, we will
make a regression line (like a fancy line of best fit that you use for predictions), and then we will add
more and more variables into the equation to try and explain more of the variance between results.
First, let’s explain what Linear Regression is simply, using our notes from BBS1003.
Linear regression looks at the correlation and continuation of a relationship between a dependant and
independent variable. You’re basically predicting Y using X, so we are looking for the best fitting line
1
,between all of the scores of the variables- essentially the best “line of best fit” for a scatter plot. It has
this formula
, which is essentially the same as the normal Y=mx+c for a linear line.
Y is the dependent variable (it’s value is literally dependent on the rest of the equation), X is the
independent variable. E is the error value.
B0 is the Y- intercept and B1 is the slope. When we don’t know the exact values, we estimate, and we
mark that its an estimate by giving the B a hat.
Capital B is for the population and lower case b, or B^ is for the sample. I will stick to using b1 and b0.
For the population the error is the curly capital E; for the sample, its a normal “e”.
When you have the equation of the line itself, there is no e value. Therefore it is written as
. This is where the mean of Y (for a given X value) is equal to the equation of the line,
because that point is on the line.
Thus, when X is 0, Y is equal only to b0, which is thus the Y intercept and also the mean of Y when X is
equal to 0.
If X were to increase by 1, then the mean of Y given X changes by b1. Or, in other words, b1 is the change
in the mean of Y for a 1 unit change in X.
It follows on that if X increases by 3, Y increases by 3*b1.
Finding b1 and b0
Ok, now lets move onto BBS2007 stuff. Anything in red is a line from the syllabus.
Some of will look really shitty, but I promise you it’s ok. If you’re confused, the lecture is only 55
minutes and I found it pretty easy to grasp with Prof Ambergen explaining it.
We will explain linear regression using the results from a study into whether eating meat or eating fish
had any effect on how long you would bleed for after having a small cut on the arm. There were 84
2
,participants, split into a group of fish eaters (n=42) and meat eaters (n=42). Their bleeding time (bt) was
measured twice- before the study (bt0) and after 6 weeks of a fish or meat diet (bt6).
Ho = No difference between bt6 of fish group and meat group
Ha = Difference between bt6 of fish group and meat group.
This study was conducted as a partnership between three locations- Maastricht, Tromso and Zeist. The
locations were given codes so that they could be referred back to later.
Maastricht = 4
Tromso =5
Zeist =6
The fish and meat groups were also given codes. Fish =1, Meat =0.
All of the information I have just said is important! It will come back later!! Coding your variables makes
a big difference, plz remember it.
This means that the results initially look something a bit like this. Very dull, basic ass information, just
the people who did the study etc.
3
, 4