
Bradford Assays
Measures Protein Concentrations
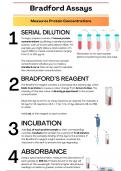
SERIAL DILUTION
1 To begin, prepare a series of known protein
concentrations by diluting a standard protein
solution, such as bovine saline albumin (BSA). For
example, you might dilute a stock solution of 1
mg/mL BSA to create concentrations ranging
from 0 to 100 µg/mL Remember to mix each sample
before transferring to the next tube.
The measurements from the known protein
concentrations will allow you to create a
standard curve that can be used to calculate
the unknown protein concentrations.
BRADFORD’S REAGENT
2 The Bradford’s reagent contains a Coomassie blue staining dye, which
binds to proteins to cause a colour change from brown to blue. The
intensity of the blue colour is directly proportional to the protein
concentration.
Dilute the dye to 1X for as many reactions as required. For example, a
5X dye for 35 reactions: 35/5 = 7. So 7 mL of dye diluted in 28 mL PBS
or water.
Add 1 mL of the reagent to each cuvette.
INCUBATION
3 Add 5 µL of each protein sample to their corresponding
cuvettes. Incubate the samples for a period of 5-15 minutes
to ensure the complete binding of the dye to the proteins. If
the Bradford’s reagent is light-sensitive, incubate the
reactions in the dark to prevent the dye degrading.
ABSORBANCE
4 Using a spectrophotometer, measure the absorbance of
each sample at 595 nm. Proteins bound to the dye will
absorb at this wavelength, therefore higher absorbance
readings correlate to greater protein concentrations.


