Business research II Quarter 3&4
30 multiple choice (18 from Research and 12 from Statistics/SPSS) and 3 open questions on
statistics
Statistics
Describes a set of tools and techniques that is used to describe, organize and interpret data
that are collected
Relevance:
• Marketing research (consumer behaviour, customer satisfaction, awareness,
preferences, etc.)
• Business research (work placement, thesis)
• Trend of “big data” (more, faster, more diversity) -> data not only to support business
processes, but for the purpose of analysis.
Companies use data to support decision making!
Statistics Week 3
Nominal: categories, no order, f.ex male and female
Ordinal: categories, with order f.ex military rank
Interval: measurable difference between the different outcomes
Ratio: like interval but there is an absolute zero
,It is important to recognize that there is a hierarchy implied in the level of measurement idea.
At lower levels of Measurement, assumptions tend to be less restrictive an data anaylsis tend
to be less sensitive. At each level up the hierarchy, the current level includes all of the
qualities of the one below it and adds something new. In general, it is desirable to have a
higher level of measurement (e.g. interval or ratio) rather than a lower one (nominal or
ordinal)
Exercise in class
Nominal: Do you have an income? Yes or No
Ordinal: low, medium, high
Internal: categories of income
Ratio: what they earn
Difference between descriptive and Inferential statistics
Descriptive statistics
Describing the characteristics of a set of data (entire population)
Mean, modus, median, standard deviation
Making tables and charts
Inferential statistics
Using data of a smaller group to conclude something about the bigger group
Sample versus population
Estimating
Testing
,Distribution- different appearances
Averages
Variability or standard deviation
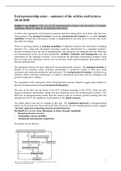
, Distribution
Normal Distribution
If STDV is high: flat curve
If STDV is low: high curve
You may compare it with exam grades
30 multiple choice (18 from Research and 12 from Statistics/SPSS) and 3 open questions on
statistics
Statistics
Describes a set of tools and techniques that is used to describe, organize and interpret data
that are collected
Relevance:
• Marketing research (consumer behaviour, customer satisfaction, awareness,
preferences, etc.)
• Business research (work placement, thesis)
• Trend of “big data” (more, faster, more diversity) -> data not only to support business
processes, but for the purpose of analysis.
Companies use data to support decision making!
Statistics Week 3
Nominal: categories, no order, f.ex male and female
Ordinal: categories, with order f.ex military rank
Interval: measurable difference between the different outcomes
Ratio: like interval but there is an absolute zero
,It is important to recognize that there is a hierarchy implied in the level of measurement idea.
At lower levels of Measurement, assumptions tend to be less restrictive an data anaylsis tend
to be less sensitive. At each level up the hierarchy, the current level includes all of the
qualities of the one below it and adds something new. In general, it is desirable to have a
higher level of measurement (e.g. interval or ratio) rather than a lower one (nominal or
ordinal)
Exercise in class
Nominal: Do you have an income? Yes or No
Ordinal: low, medium, high
Internal: categories of income
Ratio: what they earn
Difference between descriptive and Inferential statistics
Descriptive statistics
Describing the characteristics of a set of data (entire population)
Mean, modus, median, standard deviation
Making tables and charts
Inferential statistics
Using data of a smaller group to conclude something about the bigger group
Sample versus population
Estimating
Testing
,Distribution- different appearances
Averages
Variability or standard deviation
, Distribution
Normal Distribution
If STDV is high: flat curve
If STDV is low: high curve
You may compare it with exam grades