

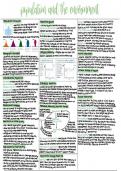
Population structure population growth Simon -
ultimate resource is the human mind , as
↑
-top shows
how long old people live ↑
pop more people to solve resource problems .
-
by environmental factors
limited
narrow points = low BR , high Dr
= war
Quality of life increases as pop. grows (some)
Optimum population all resources used to give
-
-
wide points = birth rate
high Neo-maithusians-rapid pop growth is an
highest economic return + standard of living
-
-
base-young people in pop-birth rate
development and should be slowed
O bstacle to
overpopulation too high population for the
-
available resource , standard of living falls Club of Rome used computer models -
showed
-
population structure changes as more through DTM
that continued rapid pop growth
= decline in
underpopulation too few people to use resources
-
to their full potential , standard of living falls economic growth . Use resources
sustainably .
-
Optimum Pop increases as tech improves , discover Boserup-however big the pop-produces
new resources
. Depends on structure
Sufficient food Farming will become more intensive
.
-
lower
as find new methods and
dependency ratio tech eg GM Crops. Its
=
higher pop-economic growth uncertain it food production can keep up long term
dividend carrying capacity largest pop. an area can
Demographic
-
Ozone depletion
Support, depends on pop Size and resources
potential for economic dependency growth as
.
- -
Ozone absorbs harmful uV , less Ozone = more
. The death rate falls before the birth
ratio falls U radiation on Earth Leads to skin cancer .
rate so theres lots of young people to work but (genetic mutations in skin) and cataracts
less people dependent on the money Leads to
Clensotebe becomes cloudy) Ozone is
.
recovering
.
economic growth as pay more taxes
. Attracts
but can see damage for 50 years
TNC's which provides more jobs
and investment
Climate change
.
on health
-
countries need to invest in demographic
dividend through education and job creation -
temp increase = hotter summers , Spread disease)
International Migration changing precipitation Spread waterborne
-
-
forced to flee , can't return
-
Agricultural productivity
↓ due to soil
Refugees -
Ecological Footprint salinisation , aesertification , extreme weather
Asylum seekers-fear of returning home-application
Saltwater intrusion, longer growing season .
Economic migrant-moved for work measures humans environmental impact by
+ decreases crop yield,
-
land needed to produce goods
-
Nutritional Standards
Push factors natural disasters , desertification , calculating . Developed
change in food type ↑ infood price , rise in
-
countries ecological footprints
impacts of climate change , political instability ,
,
larger than developing
, economic decline
countries
. As
ecological footprint ↑ the carrying Obesity , malnutrition
food and jobs
war , lack of
capacity ↓ Current populations using 16 Earths Future population
↑ ull factors desirable climate, farming conditions, By
.
-
2050 , pop a 6 billion will be
.
care access , using earths
-
less climate change impacts , health
.
-
measured in global hectares-shows the amount of Predicted that by 2100- pop at 11 2 bil due to
-
.
job opportunities , higher salaries , quality of life land needed for
average productivity falling fertility rate and increased life expectancy
.
patterns and processes Population , resources , pollution model un has 3 predictions based on fertility rate
changes
-
-
limit on number of migrants they will accept Population distribution developed countries
-
negative effects have low fertility rates , low pop
control where they accept migrants from
population growth By 2050
,
&
.
eg problem ,
-
. health most of popin
S
Asia as have large pop growth
expensive , dangerous journey ,
↓ aspop,resources
language barriers Climate
- .
change Then largest pop's in India China
-
language and culture ties help Migration , , Nigeria
-
may need to prove they have skills host country want mining +
Environment more people use more resources
Pollution & Resource as
-
Implication for home country ↑ deforestation
ac quisition
resources
higher standard of living
Pop growth = environment.
- ↓
decline, ageing pop
Produce Pollution
benefit the damage Increased consumption due to economic
Gender imbalance
.
-
pop .
-
+
damage Pop e g food &evelopment Pop is more efficient due
brain drain' "Se environment
to
. .
-
Send remittances, as skilled leave & but pop can also d tech and
Resource regulations but if consumptions]
try to discourage people leaving
uxion
· as
-
X resources used up
on healthcare as uninerable left resources
use efficiency-exhaustion
-
pressure =
eg gases Relationship-tech advances can help reduce
-
improves environment as less resource pressure ,
less funding for environmental management PRP positive feedback-pop, growth t more food
Pollution Mitigate climate change Share this
+ .
to
splits up families , Chance to find job , less > supports more people as theres more
developing countries. Education can
change
-
production - their behaviours t help environment
. Policies help
pressure on education > more pop, growth
> drive to improve yields - reduce countries
, loss of culture food - resource consumption
.
Implication for host country PRP negative feedback-growing pop. intensifies
> increased soil erosion -
agriculture - > decreases
-
pop. growth , ↑BR as more child-bearing age , > food production can't support -
Yields - > popd
increase working age
-
expansion of workforce-fill jobs grow economy Population change theories
policies to reduce immigration ,
groups
-
retaliate
mothus-pop- can grow quicker than
pressure on healthcare capacity to
bring infectious disease
-
,
feed itself , pop grows exponentially but food
-
build on green spaces, resource extraction , Supply grows arithmetic When pop food available ,
more waste
, pollution + environmental damage
.
Pop is reduced by war and famine
-
cultural diversity , tensions from locals
ultimate resource is the human mind , as
↑
-top shows
how long old people live ↑
pop more people to solve resource problems .
-
by environmental factors
limited
narrow points = low BR , high Dr
= war
Quality of life increases as pop. grows (some)
Optimum population all resources used to give
-
-
wide points = birth rate
high Neo-maithusians-rapid pop growth is an
highest economic return + standard of living
-
-
base-young people in pop-birth rate
development and should be slowed
O bstacle to
overpopulation too high population for the
-
available resource , standard of living falls Club of Rome used computer models -
showed
-
population structure changes as more through DTM
that continued rapid pop growth
= decline in
underpopulation too few people to use resources
-
to their full potential , standard of living falls economic growth . Use resources
sustainably .
-
Optimum Pop increases as tech improves , discover Boserup-however big the pop-produces
new resources
. Depends on structure
Sufficient food Farming will become more intensive
.
-
lower
as find new methods and
dependency ratio tech eg GM Crops. Its
=
higher pop-economic growth uncertain it food production can keep up long term
dividend carrying capacity largest pop. an area can
Demographic
-
Ozone depletion
Support, depends on pop Size and resources
potential for economic dependency growth as
.
- -
Ozone absorbs harmful uV , less Ozone = more
. The death rate falls before the birth
ratio falls U radiation on Earth Leads to skin cancer .
rate so theres lots of young people to work but (genetic mutations in skin) and cataracts
less people dependent on the money Leads to
Clensotebe becomes cloudy) Ozone is
.
recovering
.
economic growth as pay more taxes
. Attracts
but can see damage for 50 years
TNC's which provides more jobs
and investment
Climate change
.
on health
-
countries need to invest in demographic
dividend through education and job creation -
temp increase = hotter summers , Spread disease)
International Migration changing precipitation Spread waterborne
-
-
forced to flee , can't return
-
Agricultural productivity
↓ due to soil
Refugees -
Ecological Footprint salinisation , aesertification , extreme weather
Asylum seekers-fear of returning home-application
Saltwater intrusion, longer growing season .
Economic migrant-moved for work measures humans environmental impact by
+ decreases crop yield,
-
land needed to produce goods
-
Nutritional Standards
Push factors natural disasters , desertification , calculating . Developed
change in food type ↑ infood price , rise in
-
countries ecological footprints
impacts of climate change , political instability ,
,
larger than developing
, economic decline
countries
. As
ecological footprint ↑ the carrying Obesity , malnutrition
food and jobs
war , lack of
capacity ↓ Current populations using 16 Earths Future population
↑ ull factors desirable climate, farming conditions, By
.
-
2050 , pop a 6 billion will be
.
care access , using earths
-
less climate change impacts , health
.
-
measured in global hectares-shows the amount of Predicted that by 2100- pop at 11 2 bil due to
-
.
job opportunities , higher salaries , quality of life land needed for
average productivity falling fertility rate and increased life expectancy
.
patterns and processes Population , resources , pollution model un has 3 predictions based on fertility rate
changes
-
-
limit on number of migrants they will accept Population distribution developed countries
-
negative effects have low fertility rates , low pop
control where they accept migrants from
population growth By 2050
,
&
.
eg problem ,
-
. health most of popin
S
Asia as have large pop growth
expensive , dangerous journey ,
↓ aspop,resources
language barriers Climate
- .
change Then largest pop's in India China
-
language and culture ties help Migration , , Nigeria
-
may need to prove they have skills host country want mining +
Environment more people use more resources
Pollution & Resource as
-
Implication for home country ↑ deforestation
ac quisition
resources
higher standard of living
Pop growth = environment.
- ↓
decline, ageing pop
Produce Pollution
benefit the damage Increased consumption due to economic
Gender imbalance
.
-
pop .
-
+
damage Pop e g food &evelopment Pop is more efficient due
brain drain' "Se environment
to
. .
-
Send remittances, as skilled leave & but pop can also d tech and
Resource regulations but if consumptions]
try to discourage people leaving
uxion
· as
-
X resources used up
on healthcare as uninerable left resources
use efficiency-exhaustion
-
pressure =
eg gases Relationship-tech advances can help reduce
-
improves environment as less resource pressure ,
less funding for environmental management PRP positive feedback-pop, growth t more food
Pollution Mitigate climate change Share this
+ .
to
splits up families , Chance to find job , less > supports more people as theres more
developing countries. Education can
change
-
production - their behaviours t help environment
. Policies help
pressure on education > more pop, growth
> drive to improve yields - reduce countries
, loss of culture food - resource consumption
.
Implication for host country PRP negative feedback-growing pop. intensifies
> increased soil erosion -
agriculture - > decreases
-
pop. growth , ↑BR as more child-bearing age , > food production can't support -
Yields - > popd
increase working age
-
expansion of workforce-fill jobs grow economy Population change theories
policies to reduce immigration ,
groups
-
retaliate
mothus-pop- can grow quicker than
pressure on healthcare capacity to
bring infectious disease
-
,
feed itself , pop grows exponentially but food
-
build on green spaces, resource extraction , Supply grows arithmetic When pop food available ,
more waste
, pollution + environmental damage
.
Pop is reduced by war and famine
-
cultural diversity , tensions from locals


