Unit 19 – Sampling
19.1. Sampling
Two aspects of observa/on
When you observe something, we always think of variables (our theore9cal construct) and
units, that are described by the variable.
® The rela9onship between the theore9cal variable and data is best described by
conceptualiza9on, opera9onaliza9on, and measurement.
® The rela9onship between the units and the data has to do with sampling.
How well do the data reflect my units of analysis?
® Evaluate our data by thinking about the sampling process.
Sampling > a technique that involves taking a small number of par9cipants from a much bigger
group.
When sampling?
If not, all units men9oned in our research ques9on can be studied, we need to ‘sample’.
® Studying a smaller set of units with the aim to say something about all units.
1
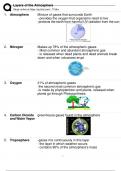
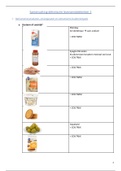
,What is sampling?
This is called the sampling process
® The rela9onship between the sampling frame and the sample is called sampling.
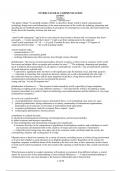
Distor/ons in the process
In all steps in the sampling process, we could find distor9ons.
® If the response rate is 100% > everyone we selected in the sample is actually
interviewed.
2 different types of sampling procedures
To dis9nguish these two types, you have to ask this ques9on: is the chance that a specific unit
from the sampling frame is included in the study, known?
• No: Non-probability sampling
• Yes: Probability sampling
(Examples of) non-probability sampling
® Convenience sampling
® Purposive sampling
® Snowball sampling
® Quota sampling
Example > opt-in survey of some newspaper
Selected units do NOT necessarily reflect the popula?on. The sample is probably ‘biased’.
2
,(Example of) probability sampling
® Simple sampling
® Stra9fied sampling
® (mul9-stage) cluster sampling
Example > simple random sample from the popula<on registry.
Selected units reflect the popula?on.
Assessing sampling
We always make sampling mistakes.
Two types of mistakes:
o Sampling bias > sampling invalidity
o Sampling error > sampling unreliability
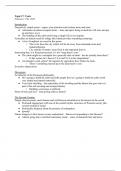
Sampling bias
Bias > not being typical for the popula9on. Studying the wrong group of people.
Example > how many people in the Netherlands currently support the EU?
Using snowball sampling > interviewing a person and asking that person for names who also
are be willing to interviewed.
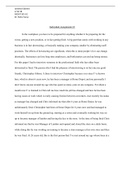
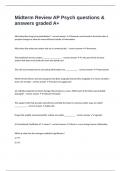
Sampling error
Sampling error is a consequence of sample size and characteris9cs of the popula9on.
Example > how many people in the Netherlands currently support the EU?
Sample size 5 and sample size 400
Evalua/ng sampling procedures
Non-probability sampling
® Bias > sample size rela9vely unimportant
Probability sampling
® No bias > sample size affects sampling error
19.2. Sample and popula2ons
It is almost impossible to ask all ‘students’ > so you decide to make a sample.
Computa/ons of the sample
Univariate analyses > mode, means, standard devia9on, etc.
Bivariate analyses > Pearson’s R or regression analyses.
® All numerical summaries resul9ng from these computa9ons are fully based on the
sample > called sta9s9cs.
3
, The goal > make statements about the en9re popula9on.
® We use inferen9al sta9s9cs to draw conclusions about the corresponding popula9on
parameters.
® Sta9s9cs are displayed by Roman leZers
® Parameters are displayed by Greek leZers
You want to know the value of popula9on parameter μ (Greek leZer ‘mu’).
® Methods of inferen9al sta9s9cs can help us answer such ques9ons.
5.3. Sampling
Inferen<al sta<s<cs > reverse to methods to draw conclusions about a popula9on based on
data coming from a sample.
Sample > sub set of a popula9on
® You want a representa9ve sample > a micro version of the en9re popula9on
o You can use a simple random sample > each subject has a same chance of being
selected.
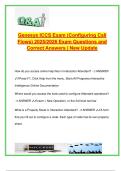
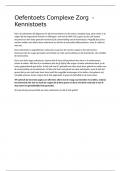
Simple random sample
1. Popula9on > you have to make clear what the popula9on is look like
2. Sampling frame > make a list of all subjects
3. Sampling > you ask a computer to randomly select ‘200 students’ out of this list
4. Respondents > how you going to approaches your ‘200 students’
4
19.1. Sampling
Two aspects of observa/on
When you observe something, we always think of variables (our theore9cal construct) and
units, that are described by the variable.
® The rela9onship between the theore9cal variable and data is best described by
conceptualiza9on, opera9onaliza9on, and measurement.
® The rela9onship between the units and the data has to do with sampling.
How well do the data reflect my units of analysis?
® Evaluate our data by thinking about the sampling process.
Sampling > a technique that involves taking a small number of par9cipants from a much bigger
group.
When sampling?
If not, all units men9oned in our research ques9on can be studied, we need to ‘sample’.
® Studying a smaller set of units with the aim to say something about all units.
1
,What is sampling?
This is called the sampling process
® The rela9onship between the sampling frame and the sample is called sampling.
Distor/ons in the process
In all steps in the sampling process, we could find distor9ons.
® If the response rate is 100% > everyone we selected in the sample is actually
interviewed.
2 different types of sampling procedures
To dis9nguish these two types, you have to ask this ques9on: is the chance that a specific unit
from the sampling frame is included in the study, known?
• No: Non-probability sampling
• Yes: Probability sampling
(Examples of) non-probability sampling
® Convenience sampling
® Purposive sampling
® Snowball sampling
® Quota sampling
Example > opt-in survey of some newspaper
Selected units do NOT necessarily reflect the popula?on. The sample is probably ‘biased’.
2
,(Example of) probability sampling
® Simple sampling
® Stra9fied sampling
® (mul9-stage) cluster sampling
Example > simple random sample from the popula<on registry.
Selected units reflect the popula?on.
Assessing sampling
We always make sampling mistakes.
Two types of mistakes:
o Sampling bias > sampling invalidity
o Sampling error > sampling unreliability
Sampling bias
Bias > not being typical for the popula9on. Studying the wrong group of people.
Example > how many people in the Netherlands currently support the EU?
Using snowball sampling > interviewing a person and asking that person for names who also
are be willing to interviewed.
Sampling error
Sampling error is a consequence of sample size and characteris9cs of the popula9on.
Example > how many people in the Netherlands currently support the EU?
Sample size 5 and sample size 400
Evalua/ng sampling procedures
Non-probability sampling
® Bias > sample size rela9vely unimportant
Probability sampling
® No bias > sample size affects sampling error
19.2. Sample and popula2ons
It is almost impossible to ask all ‘students’ > so you decide to make a sample.
Computa/ons of the sample
Univariate analyses > mode, means, standard devia9on, etc.
Bivariate analyses > Pearson’s R or regression analyses.
® All numerical summaries resul9ng from these computa9ons are fully based on the
sample > called sta9s9cs.
3
, The goal > make statements about the en9re popula9on.
® We use inferen9al sta9s9cs to draw conclusions about the corresponding popula9on
parameters.
® Sta9s9cs are displayed by Roman leZers
® Parameters are displayed by Greek leZers
You want to know the value of popula9on parameter μ (Greek leZer ‘mu’).
® Methods of inferen9al sta9s9cs can help us answer such ques9ons.
5.3. Sampling
Inferen<al sta<s<cs > reverse to methods to draw conclusions about a popula9on based on
data coming from a sample.
Sample > sub set of a popula9on
® You want a representa9ve sample > a micro version of the en9re popula9on
o You can use a simple random sample > each subject has a same chance of being
selected.
Simple random sample
1. Popula9on > you have to make clear what the popula9on is look like
2. Sampling frame > make a list of all subjects
3. Sampling > you ask a computer to randomly select ‘200 students’ out of this list
4. Respondents > how you going to approaches your ‘200 students’
4