Unit 14 – Causality and the effect of third variables
14.1. The effect of third variables - thinking about trivariate hypotheses
Tes$ng bivariate hypothesis is checking,
® Time order of cause and effect
® Correla4on/associa4on
® Effect of third variables, when you introduce the third variable, you check,
o Theorizing about the effect of third variables
o Formula0ng a trivariate hypothesis
o Tes0ng the trivariate hypothesis
Poten&al effects of ‘third variables’
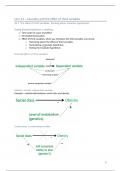
Addi&on: another independent variable
Example > rela0onship between social class and obesity
Confounding: a confounding variable
1
,Interpreta&on: an intervening variable
Confounding or interpreta$on?
It is important to look at the 4me order,
® If the (original) independent variable precedes the third variable in 4me >
interpreta(on.
® If the (original) independent variable is explained by the third variable > confounding.
Trivariate hypothesis
® AHer the introduc4on of the third (test) variable (men(on the third variable). The
bivariate rela4onship (men(on the original bivariate hypothesis > disappears,
changes, remains the same). And the test variable is related to the other variables
(outline the model).
14.2. The effect of third variables – confounding
Example > rela0onship between # of storks and # of babies (per capita) in municipali0es
The bivariate expecta$on in a model
Supposed there is a rela4onship between the numbers of babies and the numbers of storks >
you may assume that there is a causal rela4onship, but then you nothing about biology.
® Why is there no rela4onship?
2
,The expecta&on in a graph
Tes&ng the causal rela&onship
® Correct 4me order is assumed
® We found an associa4on
What would be the ‘theore4cal argumenta4on’ about why this is s4ll NOT a causal
rela4onship? > it has to do with the ‘third variable’…
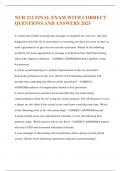
Confounding in a model
Theorizing why there is no causal rela4onship between the number of babies and the number
of storks.
3
, ® The rela4onship between the independent and the dependent variable is produced by
a confounder variable > effects both the independent variable and dependent
variable. But there is no rela4onship between the independent and dependent
variable.
14.3. The effect of third variables – interpreta?on
Example > rela0onship between study 0me and grades of students
A bivariate expecta$on can be shown in a model like this
Grades > dependent variable (y-as)
Study 4me > independent variable (x-as)
® The rela4onship is posi4ve
The expecta$ons can also be displayed in a graph
Tes$ng the causal rela$onship
• (correct 4me order is assumed)
• (we found an associa4on)
4
14.1. The effect of third variables - thinking about trivariate hypotheses
Tes$ng bivariate hypothesis is checking,
® Time order of cause and effect
® Correla4on/associa4on
® Effect of third variables, when you introduce the third variable, you check,
o Theorizing about the effect of third variables
o Formula0ng a trivariate hypothesis
o Tes0ng the trivariate hypothesis
Poten&al effects of ‘third variables’
Addi&on: another independent variable
Example > rela0onship between social class and obesity
Confounding: a confounding variable
1
,Interpreta&on: an intervening variable
Confounding or interpreta$on?
It is important to look at the 4me order,
® If the (original) independent variable precedes the third variable in 4me >
interpreta(on.
® If the (original) independent variable is explained by the third variable > confounding.
Trivariate hypothesis
® AHer the introduc4on of the third (test) variable (men(on the third variable). The
bivariate rela4onship (men(on the original bivariate hypothesis > disappears,
changes, remains the same). And the test variable is related to the other variables
(outline the model).
14.2. The effect of third variables – confounding
Example > rela0onship between # of storks and # of babies (per capita) in municipali0es
The bivariate expecta$on in a model
Supposed there is a rela4onship between the numbers of babies and the numbers of storks >
you may assume that there is a causal rela4onship, but then you nothing about biology.
® Why is there no rela4onship?
2
,The expecta&on in a graph
Tes&ng the causal rela&onship
® Correct 4me order is assumed
® We found an associa4on
What would be the ‘theore4cal argumenta4on’ about why this is s4ll NOT a causal
rela4onship? > it has to do with the ‘third variable’…
Confounding in a model
Theorizing why there is no causal rela4onship between the number of babies and the number
of storks.
3
, ® The rela4onship between the independent and the dependent variable is produced by
a confounder variable > effects both the independent variable and dependent
variable. But there is no rela4onship between the independent and dependent
variable.
14.3. The effect of third variables – interpreta?on
Example > rela0onship between study 0me and grades of students
A bivariate expecta$on can be shown in a model like this
Grades > dependent variable (y-as)
Study 4me > independent variable (x-as)
® The rela4onship is posi4ve
The expecta$ons can also be displayed in a graph
Tes$ng the causal rela$onship
• (correct 4me order is assumed)
• (we found an associa4on)
4