Statistics
Table of Contents
Statistics ...........................................................................................................................1
Knowledge clip 1 and chapter 1 ................................................................................................ 2
Knowledge clip 2 and chapter 2 ................................................................................................ 4
Knowledge clip 3 and chapter 3 ................................................................................................ 4
Knowledge clip 4 and chapter 2.3, 2.4 and 3.5 ........................................................................... 6
Knowledge clip 5A and chapter 4 .............................................................................................. 8
Knowledge clip 5B and chapter 5 and 6 ................................................................................... 11
Knowledge clip 6A chapter 7 and 8 ......................................................................................... 15
Knowledge clip 6B chapter 7 and 8 ......................................................................................... 17
Knowledge clip 7 chapter ....................................................................................................... 19
Knowledge clip 8 chapter ....................................................................................................... 20
Knowledge clip 9 chapter 14, 15 and 16 .................................................................................. 22
,Knowledge clip 1 and chapter 1
Statistics:
• The art of sciene
• Collecting, analyzing, presenting and interpreting data
• Providing information to support decision-making
Data matrix:
• Columns = variables
• Rows = observations, elements, cases, subjects
• Each cell = measurement, data point
Types of variables: level of measurement
• Nominal data: categories
• Ordinal data: ordered categories (sport competitions, from unsatisfied to satisfied)
• Interval data: differences between measurements but no true zero
• Ratio data: differences between measurements, true zero exists
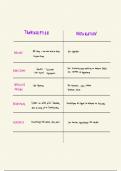
, Types of data sets:
• Cross-sectional data
o Survey of cases, all measured at one period of time
• Time-series data
o Variables measured over time (stock prices)
• Panel data
o Combination of both: multiple cases, same variables measured at multiple
time points (every year the same survey)
Sources of data:
• Primary data
• Secondary data
Key statistical concepts:
• Population: the group of all items/cases of interest
• Sample: the group of items/cases drawn from the population
Table of Contents
Statistics ...........................................................................................................................1
Knowledge clip 1 and chapter 1 ................................................................................................ 2
Knowledge clip 2 and chapter 2 ................................................................................................ 4
Knowledge clip 3 and chapter 3 ................................................................................................ 4
Knowledge clip 4 and chapter 2.3, 2.4 and 3.5 ........................................................................... 6
Knowledge clip 5A and chapter 4 .............................................................................................. 8
Knowledge clip 5B and chapter 5 and 6 ................................................................................... 11
Knowledge clip 6A chapter 7 and 8 ......................................................................................... 15
Knowledge clip 6B chapter 7 and 8 ......................................................................................... 17
Knowledge clip 7 chapter ....................................................................................................... 19
Knowledge clip 8 chapter ....................................................................................................... 20
Knowledge clip 9 chapter 14, 15 and 16 .................................................................................. 22
,Knowledge clip 1 and chapter 1
Statistics:
• The art of sciene
• Collecting, analyzing, presenting and interpreting data
• Providing information to support decision-making
Data matrix:
• Columns = variables
• Rows = observations, elements, cases, subjects
• Each cell = measurement, data point
Types of variables: level of measurement
• Nominal data: categories
• Ordinal data: ordered categories (sport competitions, from unsatisfied to satisfied)
• Interval data: differences between measurements but no true zero
• Ratio data: differences between measurements, true zero exists
, Types of data sets:
• Cross-sectional data
o Survey of cases, all measured at one period of time
• Time-series data
o Variables measured over time (stock prices)
• Panel data
o Combination of both: multiple cases, same variables measured at multiple
time points (every year the same survey)
Sources of data:
• Primary data
• Secondary data
Key statistical concepts:
• Population: the group of all items/cases of interest
• Sample: the group of items/cases drawn from the population