Data Mining Essentials
Supervised vs Unsupervised Learning
- Supervised learning
o Classification (cat | dog | mouse)
o Regression (24 | 3 | 32 | 10)
- Unsupervised ‘learning’
o Clustering ( a b c | k l m | x y z)
o Dimensionality reduction (X1, X2, X3, X4, X5 –X3, –X5)
Overall goal of both methods: extract from dataset with goal to generalize.
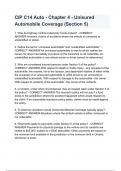
Supervised Learning
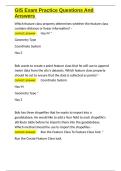
- Training set with vectors | categorised (colours)
- Flowchart: raw data collection » pre-processing » sampling » re-processing » learning
algorithm training » hyperparameter optimisation » post-processing » final classification /
regression model
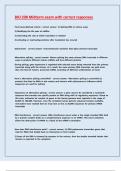
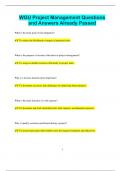
Pre-processing
Feature transformation:
- Categorical variables
o Nominal (green » [0,1,0])
o Ordinal (XL » 3)
- Normalisation and outlier removal
o Z-score (mean/SD)
o Remove outliers (depends on your goal)
- Vector normalisation
o L2-norm (√∑x²) ○
o L1-norm (∑|x|) ◊
Data Exploration and Visualisation (descriptive analysis)
- Sort or rearrange your data
- Goal of thesis: how well following the guidelines?
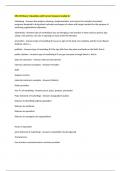
Splitting your data
- The fundamental goal is to generalize beyond the data instances used to train models
- Never touch the test data (until the end)
- Test data must belong to the same (statistical) distribution as the training data!
1. Sequential Split: for example a time series, typically train on a period, for example one 1-6
and test on 7-8. Common pitfall is cycles in the data (on different time-scales).
2. Random Split: blindly assign instances to training…….
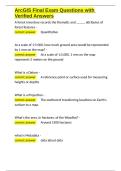
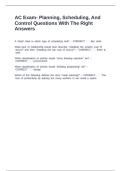
Sampling and splitting your data
- In the case of small data, you want to check
(stratify) your data in terms of target, or at
least check if the ratios are representative.
- In the case of unbalanced data you might
want to stratify your data.
Supervised vs Unsupervised Learning
- Supervised learning
o Classification (cat | dog | mouse)
o Regression (24 | 3 | 32 | 10)
- Unsupervised ‘learning’
o Clustering ( a b c | k l m | x y z)
o Dimensionality reduction (X1, X2, X3, X4, X5 –X3, –X5)
Overall goal of both methods: extract from dataset with goal to generalize.
Supervised Learning
- Training set with vectors | categorised (colours)
- Flowchart: raw data collection » pre-processing » sampling » re-processing » learning
algorithm training » hyperparameter optimisation » post-processing » final classification /
regression model
Pre-processing
Feature transformation:
- Categorical variables
o Nominal (green » [0,1,0])
o Ordinal (XL » 3)
- Normalisation and outlier removal
o Z-score (mean/SD)
o Remove outliers (depends on your goal)
- Vector normalisation
o L2-norm (√∑x²) ○
o L1-norm (∑|x|) ◊
Data Exploration and Visualisation (descriptive analysis)
- Sort or rearrange your data
- Goal of thesis: how well following the guidelines?
Splitting your data
- The fundamental goal is to generalize beyond the data instances used to train models
- Never touch the test data (until the end)
- Test data must belong to the same (statistical) distribution as the training data!
1. Sequential Split: for example a time series, typically train on a period, for example one 1-6
and test on 7-8. Common pitfall is cycles in the data (on different time-scales).
2. Random Split: blindly assign instances to training…….
Sampling and splitting your data
- In the case of small data, you want to check
(stratify) your data in terms of target, or at
least check if the ratios are representative.
- In the case of unbalanced data you might
want to stratify your data.