

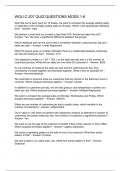
WGU C-207 Quiz Questions Mods 1-6
Now that we've been open for 15 weeks, we want to compare the average weekly sales on Saturday to the average weekly sales on Sunday. Which is the appropriate statistical test? - Answer- t-test We perform a t-test and our p-value is less than 0.05. Should we reject the null? - Answer- Yes. We have a significant difference between the groups. Which statistical test can we use to test a correlation between customers per day and sales per day? - Answer- Linear Regression Which R-square gives us a better indication there is a relationship between customers per day and sales per day? - Answer- 0.75 Our regression model is y = 50 + 10X. y is the sales per day and x is the number of customers per day. What will our sales be if we have 20 customers? - Answer- $250 As we continue to measure the sales per day and the customers per day, they consistently increase together and decrease together. What is this an example of? - Answer- Homoscedasticity We would like to examine what our customers that buy donuts in the afternoon have in common. Which analysis technique applies? - Answer- Cluster In addition to customers per day, we are also going to use temperature to predict our sales per day. Which analysis technique applies? - Answer- Multiple Regression We wish to compare the average sales on Monday, Wednesday and Friday. Which analysis technique applies? - Answer- ANOVA When we use number of customers per day to predict sales, which variable is the number of customers? - Answer- Independent Our p-value is .042 when we perform the regression analysis to determine if number of customers can predict sales per day. Are number of customers a significant predictor? - Answer- Yes We want to use the age of the customer to predict if they order creamer in their coffee. Which analysis technique applies? - Answer- Logistic regression We notice a repeating pattern in the sale of one of our products. What time series pattern is this? - Answer- Cyclical We see a peak in our sales each July. What time series pattern is this? - Answer- S
Document information
- Uploaded on
- November 12, 2023
- Number of pages
- 6
- Written in
- 2023/2024
- Type
- Exam (elaborations)
- Contains
- Questions & answers


