Populations – AQA A Level Biology Summary Notes
Distribution
- Where a particular species is within an area
- Uniform, random, clumped?
Abundance
- The number of individuals of one species in a particular area
- Can be estimated by simply counting the number of species in the samples taken
Abundance can be measured using: Quadrats
- Frequency: number of samples of a species found in area
- Percentage cover: only used for non-motile/slow moving species – how much of the area is
covered by a species
Quadrats! How to estimate population of non-motile species eg plants OR v very slow moving
- Divide area of investigation into equal sized grids
- Select grids at random using a random number/letter generator – removes bias
- Take samples from these coordinates only
- Find the estimated mean
Estimated mean = total number of individuals counted/number of quadrats x total quadrats that fit
in whole area
Mark-release recapture
- A method used to measure the abundance of mobile species
6 steps:
- Capture a sample of a species and count them
- Mark them in a harmless way eg spot of paint or identification tag
- Release them back into their habitat
- Wait a period of time (week/month/year)
- Take a second sample using same method and count them
- Count how many were marked
Equation for total population size: Number caught in 1 st sample x Number caught in 2nd
sample/Number marked in 2nd sample
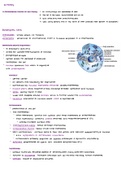
Succession
- The process by which an ecosystem changes overtime
- At each stage, animal and plant communities slowly change the environmental conditions
- Eg soil depth/pH and more/less fertile soil
This change in environmental conditions makes the area more suitable for other species with
different adaptations – these other organisms succeed (replace) the previous organisms
Primary succession
- Happens on land that’s been newly formed or exposed
- Eg volcano erupts and lava cools to form new rock
- Eg sea levels drop, exposing what was previously under the water
Distribution
- Where a particular species is within an area
- Uniform, random, clumped?
Abundance
- The number of individuals of one species in a particular area
- Can be estimated by simply counting the number of species in the samples taken
Abundance can be measured using: Quadrats
- Frequency: number of samples of a species found in area
- Percentage cover: only used for non-motile/slow moving species – how much of the area is
covered by a species
Quadrats! How to estimate population of non-motile species eg plants OR v very slow moving
- Divide area of investigation into equal sized grids
- Select grids at random using a random number/letter generator – removes bias
- Take samples from these coordinates only
- Find the estimated mean
Estimated mean = total number of individuals counted/number of quadrats x total quadrats that fit
in whole area
Mark-release recapture
- A method used to measure the abundance of mobile species
6 steps:
- Capture a sample of a species and count them
- Mark them in a harmless way eg spot of paint or identification tag
- Release them back into their habitat
- Wait a period of time (week/month/year)
- Take a second sample using same method and count them
- Count how many were marked
Equation for total population size: Number caught in 1 st sample x Number caught in 2nd
sample/Number marked in 2nd sample
Succession
- The process by which an ecosystem changes overtime
- At each stage, animal and plant communities slowly change the environmental conditions
- Eg soil depth/pH and more/less fertile soil
This change in environmental conditions makes the area more suitable for other species with
different adaptations – these other organisms succeed (replace) the previous organisms
Primary succession
- Happens on land that’s been newly formed or exposed
- Eg volcano erupts and lava cools to form new rock
- Eg sea levels drop, exposing what was previously under the water