

ASSESSMENT 4
Closing date: Tuesday, 30 May 2023 @ 23:00
Total: 70 marks
Study material: All Lessons
Use computational formulas where applicable and round off the final answer to two
decimals. (Values read from tables must be given unaltered).
QUESTION 1 [6]
IOP2601 Student Performance
10
9
8
7
6
5
4
3
2
1
0
Semester 1 2021 Semester 2 2021 Semester 1 2022 Semester 2 2022
Assignment 1 Assignment 2 Assignment 3
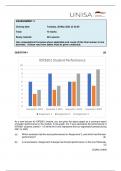
As a new lecturer for IOP2601 module, you are given the above graph as a summary report
of student performance in the module. In the graph, the Y-axis represents the performance of
IOP2601 students (rated 0 - 10) while the X-axis represents the four registration periods during
2021 to 2022.
(a) Which semester had the worst performance for Assignment 2, and which had the best
performance? (2)
(b) In all semesters, Assignment 3 always has the best performance. Is this true? Motivate.
(2)
[TURN OVER]
, 2
IOP2601/Assignment 4/Semester 1/2023
(c) As you reflect as a new lecturer for the IOP2601 module, which assignment will you
put your focus on in your improvement plan? Motivate your answer basing it on the
ratings of each assignment over the various semesters. (2)
QUESTION 2 [17]
"The more information students have about the value of statistics, the less their anxiety about
statistics"
As an Industrial Psychology student, you decide to use some of the skills you acquired in the
course to test this statement. You administer a general knowledge quiz on the value of
statistics and an anxiety about statistics questionnaire to 10 of your classmates. The collected
data is presented in the table below.
STUDENTS GENERAL KNOWLEDGE ON ANXIETY ABOUT STATISTICS (Y)
THE VALUE OF STATISTICS (X)
A 10 9
B 8 7
C 7 6
D 7 6
E 8 8
F 5 9
G 10 7
H 4 8
I 2 5
J 10 7
N = 10 ƩX = 71 ƩY = 72
(a) Complete a summation table indicating all the values required for correlation and
regression calculations. (5)
(b) Interpret the correlation coefficient when the value is 0,3. What deduction can be made
about the nature of the relationship? (3)
(c) Calculate the percentage of common variance between the two sets of scores and
then illustratethis percentage diagrammatically. (2)
When you presented the results of the calculations to your classmates, you mentioned that
you could use a certain formula to predict students’ anxiety about statistics (Y), based on their
general knowledge on the value of statistics (X) score.
(d) After further analysis, you found that the slope was 0,15 and the Y intercept was 6,14.
Calculate the students’ anxiety about statistics when their general knowledge on the
value of statistics scores are 3 and 6 respectively. (2)
(e) Provide a graphic representation of the regression line, by indicating the intercept
and predictedvalues for students with the general knowledge on the value of statistics
scores of 3 and 6 respectively. (5)
[TURN OVER]
Closing date: Tuesday, 30 May 2023 @ 23:00
Total: 70 marks
Study material: All Lessons
Use computational formulas where applicable and round off the final answer to two
decimals. (Values read from tables must be given unaltered).
QUESTION 1 [6]
IOP2601 Student Performance
10
9
8
7
6
5
4
3
2
1
0
Semester 1 2021 Semester 2 2021 Semester 1 2022 Semester 2 2022
Assignment 1 Assignment 2 Assignment 3
As a new lecturer for IOP2601 module, you are given the above graph as a summary report
of student performance in the module. In the graph, the Y-axis represents the performance of
IOP2601 students (rated 0 - 10) while the X-axis represents the four registration periods during
2021 to 2022.
(a) Which semester had the worst performance for Assignment 2, and which had the best
performance? (2)
(b) In all semesters, Assignment 3 always has the best performance. Is this true? Motivate.
(2)
[TURN OVER]
, 2
IOP2601/Assignment 4/Semester 1/2023
(c) As you reflect as a new lecturer for the IOP2601 module, which assignment will you
put your focus on in your improvement plan? Motivate your answer basing it on the
ratings of each assignment over the various semesters. (2)
QUESTION 2 [17]
"The more information students have about the value of statistics, the less their anxiety about
statistics"
As an Industrial Psychology student, you decide to use some of the skills you acquired in the
course to test this statement. You administer a general knowledge quiz on the value of
statistics and an anxiety about statistics questionnaire to 10 of your classmates. The collected
data is presented in the table below.
STUDENTS GENERAL KNOWLEDGE ON ANXIETY ABOUT STATISTICS (Y)
THE VALUE OF STATISTICS (X)
A 10 9
B 8 7
C 7 6
D 7 6
E 8 8
F 5 9
G 10 7
H 4 8
I 2 5
J 10 7
N = 10 ƩX = 71 ƩY = 72
(a) Complete a summation table indicating all the values required for correlation and
regression calculations. (5)
(b) Interpret the correlation coefficient when the value is 0,3. What deduction can be made
about the nature of the relationship? (3)
(c) Calculate the percentage of common variance between the two sets of scores and
then illustratethis percentage diagrammatically. (2)
When you presented the results of the calculations to your classmates, you mentioned that
you could use a certain formula to predict students’ anxiety about statistics (Y), based on their
general knowledge on the value of statistics (X) score.
(d) After further analysis, you found that the slope was 0,15 and the Y intercept was 6,14.
Calculate the students’ anxiety about statistics when their general knowledge on the
value of statistics scores are 3 and 6 respectively. (2)
(e) Provide a graphic representation of the regression line, by indicating the intercept
and predictedvalues for students with the general knowledge on the value of statistics
scores of 3 and 6 respectively. (5)
[TURN OVER]


