

IGCSE PHYSICS – TOPIC 1
FORCES AND MOTION
a) MOVEMENT AND POSITION
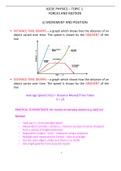
• DISTANCE-TIME GRAPHS – a graph which shows hoe the distance of an
object varied over time. The speed is shown by the GRADIENT of the
line
• DISTANCE-TIME GRAPHS – a graph which shows how the distance of an
object varies over time. The speed is shown by the GRADIENT of the
line
Average Speed (m/s) = Distance Moved/Time Taken
V = s/t
PRACTICAL TO INVESTIGATE: the motion of everyday objects (e.g. ball/car)
Method:
• I will use V = s/t to calculate speed
• Independent variable – distance – measure by tape measure, dropped
from a variety of heights/distances
• Dependent variable – time – measured using a stopclock
• Reapeat each measurement 3 times – take an average
• Use the same object, make sure there is no drafts
• Use a light gate for more accurate results
5
, Acceleration (m/s2) = Change in Velocity/Time Taken
a = (V – U)/t
• VELOCTIY-TIME GRAPHS GRAPHS – a graph which shows how the
velocity of an object varies over time. The acceleration of an object is
known by the GRADIENT (rise/run)
• DISTANCE – the area beneath the graph can tell us the distance
travelled (trapezium – 1/2a+bxh, triangle – 1/2bh)
• If the acceleration of the object is known, to find the time, use formula:
Final Speed = Initial Speed + Acceleration Time
V=u+axt
• Is the time in unknown, but distance is know, use formula:
Final Speed2 = Initial Speed2 + (2 x acceleration x distance)
V2 = U2 + (2 x a x s)
6
FORCES AND MOTION
a) MOVEMENT AND POSITION
• DISTANCE-TIME GRAPHS – a graph which shows hoe the distance of an
object varied over time. The speed is shown by the GRADIENT of the
line
• DISTANCE-TIME GRAPHS – a graph which shows how the distance of an
object varies over time. The speed is shown by the GRADIENT of the
line
Average Speed (m/s) = Distance Moved/Time Taken
V = s/t
PRACTICAL TO INVESTIGATE: the motion of everyday objects (e.g. ball/car)
Method:
• I will use V = s/t to calculate speed
• Independent variable – distance – measure by tape measure, dropped
from a variety of heights/distances
• Dependent variable – time – measured using a stopclock
• Reapeat each measurement 3 times – take an average
• Use the same object, make sure there is no drafts
• Use a light gate for more accurate results
5
, Acceleration (m/s2) = Change in Velocity/Time Taken
a = (V – U)/t
• VELOCTIY-TIME GRAPHS GRAPHS – a graph which shows how the
velocity of an object varies over time. The acceleration of an object is
known by the GRADIENT (rise/run)
• DISTANCE – the area beneath the graph can tell us the distance
travelled (trapezium – 1/2a+bxh, triangle – 1/2bh)
• If the acceleration of the object is known, to find the time, use formula:
Final Speed = Initial Speed + Acceleration Time
V=u+axt
• Is the time in unknown, but distance is know, use formula:
Final Speed2 = Initial Speed2 + (2 x acceleration x distance)
V2 = U2 + (2 x a x s)
6


