Test Bank for Modern Business Statistics with Microsoft Excel 5th Edition by Anderson Sweeney and Williams
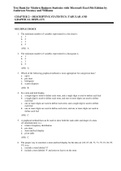
Test Bank for Modern Business Statistics with Microsoft Excel 5th Edition by Anderson Sweeney and Williams CHAPTER 2—DESCRIPTIVE STATISTICS: TABULAR AND GRAPHICAL DISPLAYS MULTIPLE CHOICE 1. The minimum number of variables represented in a bar chart is a. 1 b. 2 c. 3 d. 4 ANS: A 2. The minimum number of variables represented in a histogram is a. 1 b. 2 c. 3 d. 4 ANS: A 3. Which of the following graphical methods is most appropriate for categorical data? a. ogive b. pie chart c. histogram d. scatter diagram ANS: B 4. In a stem-and-leaf display, a. a single digit is used to define each stem, and a single digit is used to define each leaf b. a single digit is used to define each stem, and one or more digits are used to define each leaf c. one or more digits are used to define each stem, and a single digit is used to define each leaf d. one or more digits are used to define each stem, and one or more digits are used to define each leaf ANS: C
Document information
- Uploaded on
- November 27, 2022
- Number of pages
- 34
- Written in
- 2022/2023
- Type
- Exam (elaborations)
- Contains
- Questions & answers