
Week 3 Questions
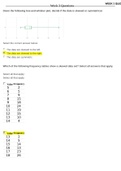
Given the following box-and-whisker plot, decide if the data is skewed or symmetrical.
Select the correct answer below:
The data are skewed to the left.
The data are skewed to the right.
The data are symmetric.
Which of the following frequency tables show a skewed data set? Select all answers that apply.
Select all that apply:
Select all that apply:
ValueFrequency
52
65
79
815
918
1024
1119
1215
1310
144
ValueFrequency
132
145
1514
1613
1723
1826
WEEK 3 QUIZ 1915
202
ValueFrequency
51
61
79
820
924
1020
119
124
131
141
151
ValueFrequency
04
112
223
328
417
57
66
73
Which of the following frequency tables show a skewed data set? Select all answers that apply.
Select all that apply:
ValueFrequency
02
111
230
322
415 512
66
71
81 ValueFrequency
41
52
63
77
819
917
1017
1115
1212
134
141
152
ValueFrequency
131
146
159
1615
1727
1828
1910
204
ValueFrequency
31
40
51
65
79
812
912
1018
1112
1217
1311
140


