Research Project
LECTURE 1: DESCRIPTION
Keller 3.1-3..1-4.4
Part A: Intro
- Slides will be leading throughout the course.
- Aim is to learn how to do empirical research and how to communicate about it.
The importance of data analysis
- Science component: Heckman and Piketty
“We should just try to collect data, establish facts and try to learn something.”
- Job market component: World Economic Forum
7.1 million jobs could be lost due to technological advancement etc.
Certain occupations will be in higher demand: data analysts - to help making sense of all the data
generated by technological disruptions.
Empiricism
= using data to look at the world.
- The old days: smart people writing forceful ideas in (mostly) beautiful prose
e.g. Smith (1776), Ricardo (1817), Marx (1867), Keynes (1936)
- Now: Empiricism; (try to) prove your claims with data → how economics is practiced today
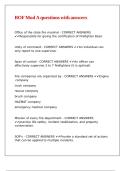
Example: does a compulsory Course-day help student choice in higher education?
- The course-day had a positive effect because there were less students who dropped out in
the first year. This is because more applicants withdrew from following the program
beforehand. The passing rate was the same with the control group as the course-day group.
- The -0.044 (= -4.4%) on the table on
the right hand side is the following
area:
- The (0.023)** in the table is the
standard error. To judge whether the
distance is big enough for it to be called statistically significantly different from 0. If it is then
there are these little stars.
- However there is a small increase in the number of students that obtain their first year
diploma within 2 years in the course-day group. So of the 4.4% of students the majority
probably fails both here and in the alternative, but there is a small group of students who
really benefitted from altering their choice.
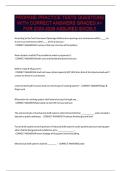
Example: does giftedness education work? → does it help to
gift bright students programs to improve their grades?
- Horizontal axes: GPA (= mean grade) in the year
prior to the current year for students that are about
15 years old. The “red” people are treated children,
they’re given a giftedness course. The “black”
children are in treated classes, those are children
in a class where there is a gifted program (but those
children themselves don’t receive the program). Do
these “red” people really benefit from the gifted
program?
- This we do by looking at their GPA. We see a strong relation between the grades that students
have this year and the grades that students had last year. We can check with the control
group, the “blue” people, if the program really helped. We can now conclude that the red is
higher than the blue line, so the “red” people clearly benefitted.
Part B: Research Project info
- You will do your own empirical study in block 6. You will choose a topic (Micro, Macro or Finance) an write a well
structured paper on it using relevant papers and data analysis. → 67% of the grade of this course.
- The exam is 33% of your grade, you must receive a 5 or higher to pass this course.
LECTURE 1: DESCRIPTION
Keller 3.1-3..1-4.4
Part A: Intro
- Slides will be leading throughout the course.
- Aim is to learn how to do empirical research and how to communicate about it.
The importance of data analysis
- Science component: Heckman and Piketty
“We should just try to collect data, establish facts and try to learn something.”
- Job market component: World Economic Forum
7.1 million jobs could be lost due to technological advancement etc.
Certain occupations will be in higher demand: data analysts - to help making sense of all the data
generated by technological disruptions.
Empiricism
= using data to look at the world.
- The old days: smart people writing forceful ideas in (mostly) beautiful prose
e.g. Smith (1776), Ricardo (1817), Marx (1867), Keynes (1936)
- Now: Empiricism; (try to) prove your claims with data → how economics is practiced today
Example: does a compulsory Course-day help student choice in higher education?
- The course-day had a positive effect because there were less students who dropped out in
the first year. This is because more applicants withdrew from following the program
beforehand. The passing rate was the same with the control group as the course-day group.
- The -0.044 (= -4.4%) on the table on
the right hand side is the following
area:
- The (0.023)** in the table is the
standard error. To judge whether the
distance is big enough for it to be called statistically significantly different from 0. If it is then
there are these little stars.
- However there is a small increase in the number of students that obtain their first year
diploma within 2 years in the course-day group. So of the 4.4% of students the majority
probably fails both here and in the alternative, but there is a small group of students who
really benefitted from altering their choice.
Example: does giftedness education work? → does it help to
gift bright students programs to improve their grades?
- Horizontal axes: GPA (= mean grade) in the year
prior to the current year for students that are about
15 years old. The “red” people are treated children,
they’re given a giftedness course. The “black”
children are in treated classes, those are children
in a class where there is a gifted program (but those
children themselves don’t receive the program). Do
these “red” people really benefit from the gifted
program?
- This we do by looking at their GPA. We see a strong relation between the grades that students
have this year and the grades that students had last year. We can check with the control
group, the “blue” people, if the program really helped. We can now conclude that the red is
higher than the blue line, so the “red” people clearly benefitted.
Part B: Research Project info
- You will do your own empirical study in block 6. You will choose a topic (Micro, Macro or Finance) an write a well
structured paper on it using relevant papers and data analysis. → 67% of the grade of this course.
- The exam is 33% of your grade, you must receive a 5 or higher to pass this course.