Exam (elaborations)
OmahaSTAT MISCSophia Statistics Final Milestone.
- Course
- Institution
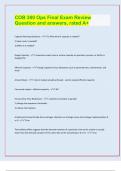
You passed this Milestone This chart shows the number of students of different age groups who participated in a quiz. Which of the following statements about the stack plot is true? There were more male students in the age group 19-21 than in the age group 15-17. There were more male ...
[Show more]