
Preview 3 out of 20 pages
Exam (elaborations)
MATH 225N MATHWeek 2 Graphs Homework Help Questions and Answers.docx Week 2 Graphs Homework Help Questions and Answers.
Preview 3 out of 20 pages
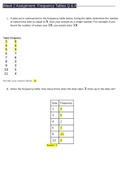
Week 2 Assignment: Frequency Tables Q & A 1. A data set is summarized in the frequency table below. Using the table, determine the number of values less than or equal to 5. Give your answer as a single number. For example if you found the number of values was 19, you would enter 19.
Document information
- Uploaded on
- February 15, 2022
- Number of pages
- 20
- Written in
- 2021/2022
- Type
- Exam (elaborations)
- Contains
- Questions & answers
$10.99
Wrong document? Swap it for free
Within 14 days of purchase and before downloading, you can choose a different document. You can simply spend the amount again.
Written by students who passed
Immediately available after payment
Read online or as PDF

Reputation scores are based on the amount of documents a seller has sold for a fee and the reviews they have received for those documents. There are three levels: Bronze, Silver and Gold. The better the reputation, the more your can rely on the quality of the sellers work.

