

Level of economic activity
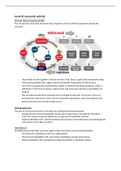
Circular flow of income model
The circular flow of income shows the flow of goods, services and their payments around the
economy.
- Households are the suppliers of factor services: land, labour, capital and entrepreneurship.
- Firms pay household rent, wages, interest and profits respectively for the services.
- Not all income generated domestically is spent on domestically produced goods. Some is
withdrawn in the form of savings, paid as taxes and some goes abroad as expenditure on
imports.
- Not all output produced by domestic firms is bought by domestic consumers. Some are
purchased by other firms in the form of investment expenditure, some are bought by the
government and some by the foreign sector.
Withdrawals (W)
The part of income earned that is not spent on domestically produced goods.
- Savings (S): the income households choose not to spend but to set aside for the future.
- Taxes (T): income tax and property tax are paid out of household incomes.
- Import expenditure (M): money that flows abroad due to domestic buyers purchasing goods
and services from other countries.
Injections (J)
Spending incurred by other economic agents other than those incurred by households.
- Investment (I): spending by firms on capital goods.
- Government expenditure (G): government spending on goods and services.
- Export expenditure (X): spending by foreign households on domestic output.
,Changes in size of circular flow of income
J>W
In 2018, the US decreased their income tax rate in the Tax Cuts and Jobs Act, which decreases the
amount of income spent on taxes. Thus decreasing withdrawals. More money is being injected than
withdrawn. Households have more disposable income so more income is spent on domestically
produced goods and services. AD becomes larger than AS. This signals to firms to increase
production which will increase employment in the country. National income also increases, causing
withdrawals to increase as savings, taxes and spending on imports increase. Withdrawals increase
until it equals to total injections, achieving equilibrium national income.
W>J
During Covid-19 pandemic, consumer confidence in Singapore has been declining due to uncertainty
in the future of the economy. Expectation of falling incomes and worsening economic conditions due
to wage cuts or unemployment remaining high led to consumers saving more and spending less. The
decrease in consumption also increases business pessimism, resulting in a fall in investment. As a
result, the value of injections is less than the value of withdrawals. Due to AD being smaller than AS,
production of goods will decrease. This causes a decrease in employment and hence a decrease in
national income of the country. As national income decreases, households will spend less on
domestically produced goods but also save less, pay less taxes and buy fewer imports. The decrease
in withdrawals will continue until withdrawals equals total injections, achieving equilibrium national
income.
Measures of economic activity
Methods
Expenditure approach Spending by households, government, firms and foreigners on final
goods and services produced within a country.
Income approach Income earned by the factors of production within a country.
- Wages → labour
- Rent → land
- Interest → capital
- Profits → entrepreneurship
Output approach Sum of primary, secondary and tertiary output.
Gross domestic product
Money value of final goods and services within the geographical boundaries of a country. (regardless
of foreigners or locals owning the resources)
Gross national product
Money value of final goods and services produced by residents of the country. (regardless of in
country or abroad)
GNP= GDP + (property income from abroad - property of income paid abroad)
, Nominal and real national income
Nominal / money national income
Goods and services valued at current prices
Real / constant price national income
Goods and services valued at constant prices
- Removes price effect to calculate real changes
- Volume of goods can be measured
GDP deflator = (current year prices / base year prices) x 100%
Real GDP = (nominal GDP / GDP deflator) x 100%
Uses of national income statistics
Indicates economic growth
Economic growth refers to the percentage increase in volume of output produced in an economy
over a period of time.
Economic growth = (Real GDPyear 2 - Real GDPyear 1)/Real GDPyear 1 x 100%
- Expenditure statistics (C,I,G,X-M)
- Income statistics (wage, profit, rent, interest)
- Output statistics (primary, secondary, tertiary)
Indicates standards of living
Standards of living refer to the material well-being and non-material well being of a person's life.
- Within a country: real GDP is used as it measures the value of output at constant prices and
any increase must mean a rise in output and hence living standards. Hence, real GDP per
capita is used to take into account population growth as a rise in population growth larger
than real GDP, implies that the individuals share of real national income will be lower.
- Between countries: real GDP per capita in common currency is used to determine the
standards of living between countries. Ceteris Paribus, the residents with higher GDP per
head are likely to enjoy a higher standard of living.
Limitations in using national income statistics to measure SOL:
(1) Measurement problems: a situation where the output of certain goods and services go
unrecorded.
- Data collection problems.
- Unrecorded economy: in 2018 Georgia, the estimated size of the shadow economy was
about 65% of the GDP, this includes undeclared income tax returns and illegal production of
goods and services.
- Non-market economy: typical for 3rd world countries where crops grown are for their own
households rather than for the market.
Circular flow of income model
The circular flow of income shows the flow of goods, services and their payments around the
economy.
- Households are the suppliers of factor services: land, labour, capital and entrepreneurship.
- Firms pay household rent, wages, interest and profits respectively for the services.
- Not all income generated domestically is spent on domestically produced goods. Some is
withdrawn in the form of savings, paid as taxes and some goes abroad as expenditure on
imports.
- Not all output produced by domestic firms is bought by domestic consumers. Some are
purchased by other firms in the form of investment expenditure, some are bought by the
government and some by the foreign sector.
Withdrawals (W)
The part of income earned that is not spent on domestically produced goods.
- Savings (S): the income households choose not to spend but to set aside for the future.
- Taxes (T): income tax and property tax are paid out of household incomes.
- Import expenditure (M): money that flows abroad due to domestic buyers purchasing goods
and services from other countries.
Injections (J)
Spending incurred by other economic agents other than those incurred by households.
- Investment (I): spending by firms on capital goods.
- Government expenditure (G): government spending on goods and services.
- Export expenditure (X): spending by foreign households on domestic output.
,Changes in size of circular flow of income
J>W
In 2018, the US decreased their income tax rate in the Tax Cuts and Jobs Act, which decreases the
amount of income spent on taxes. Thus decreasing withdrawals. More money is being injected than
withdrawn. Households have more disposable income so more income is spent on domestically
produced goods and services. AD becomes larger than AS. This signals to firms to increase
production which will increase employment in the country. National income also increases, causing
withdrawals to increase as savings, taxes and spending on imports increase. Withdrawals increase
until it equals to total injections, achieving equilibrium national income.
W>J
During Covid-19 pandemic, consumer confidence in Singapore has been declining due to uncertainty
in the future of the economy. Expectation of falling incomes and worsening economic conditions due
to wage cuts or unemployment remaining high led to consumers saving more and spending less. The
decrease in consumption also increases business pessimism, resulting in a fall in investment. As a
result, the value of injections is less than the value of withdrawals. Due to AD being smaller than AS,
production of goods will decrease. This causes a decrease in employment and hence a decrease in
national income of the country. As national income decreases, households will spend less on
domestically produced goods but also save less, pay less taxes and buy fewer imports. The decrease
in withdrawals will continue until withdrawals equals total injections, achieving equilibrium national
income.
Measures of economic activity
Methods
Expenditure approach Spending by households, government, firms and foreigners on final
goods and services produced within a country.
Income approach Income earned by the factors of production within a country.
- Wages → labour
- Rent → land
- Interest → capital
- Profits → entrepreneurship
Output approach Sum of primary, secondary and tertiary output.
Gross domestic product
Money value of final goods and services within the geographical boundaries of a country. (regardless
of foreigners or locals owning the resources)
Gross national product
Money value of final goods and services produced by residents of the country. (regardless of in
country or abroad)
GNP= GDP + (property income from abroad - property of income paid abroad)
, Nominal and real national income
Nominal / money national income
Goods and services valued at current prices
Real / constant price national income
Goods and services valued at constant prices
- Removes price effect to calculate real changes
- Volume of goods can be measured
GDP deflator = (current year prices / base year prices) x 100%
Real GDP = (nominal GDP / GDP deflator) x 100%
Uses of national income statistics
Indicates economic growth
Economic growth refers to the percentage increase in volume of output produced in an economy
over a period of time.
Economic growth = (Real GDPyear 2 - Real GDPyear 1)/Real GDPyear 1 x 100%
- Expenditure statistics (C,I,G,X-M)
- Income statistics (wage, profit, rent, interest)
- Output statistics (primary, secondary, tertiary)
Indicates standards of living
Standards of living refer to the material well-being and non-material well being of a person's life.
- Within a country: real GDP is used as it measures the value of output at constant prices and
any increase must mean a rise in output and hence living standards. Hence, real GDP per
capita is used to take into account population growth as a rise in population growth larger
than real GDP, implies that the individuals share of real national income will be lower.
- Between countries: real GDP per capita in common currency is used to determine the
standards of living between countries. Ceteris Paribus, the residents with higher GDP per
head are likely to enjoy a higher standard of living.
Limitations in using national income statistics to measure SOL:
(1) Measurement problems: a situation where the output of certain goods and services go
unrecorded.
- Data collection problems.
- Unrecorded economy: in 2018 Georgia, the estimated size of the shadow economy was
about 65% of the GDP, this includes undeclared income tax returns and illegal production of
goods and services.
- Non-market economy: typical for 3rd world countries where crops grown are for their own
households rather than for the market.


