
Bar chart, pie chart, Pareto chart
Learn 1 /7 Study with Learn
Choose
1 Quantitative
an answer data graphs 2 Categorical data graphs
Quantitative: Discrete or Continuous Bivariate Data: Comparing/Assocation
Bar3 chart, pie
Variable
chart, Pareto chart 4
looking at a bar chart
Learn 1 /7 Study with Learn
Choose
1 Quantitative
an answer data graphs 2 Categorical data graphs
Quantitative: Discrete or Continuous Bivariate Data: Comparing/Assocation
Bar3 chart, pie chart, Pareto chart 4
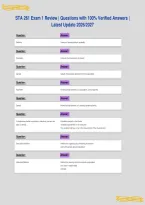
STA 261 Exam 1 Review | Questions with 100% Verified Answers |
Choose
1
Variable
Quantitative
an answer data graphs
Don't know?
2
looking at a bar chart
Categorical data graphs
Quantitative: Discrete or Continuous Bivariate Data: Comparing/Assocation
Bar chart, pie chart, Pareto chart
Latest Update 2026/2027
3
Variable
Don't know?
4
looking at a bar chart
Choose
1 Quantitative
an answer data graphs 2 Categorical data graphs
Quantitative: Discrete or Continuous Bivariate Data: Comparing/Assocation
Terms in this set (38) 3 4
Variable looking at a bar chart
Question: Choose
1 Quantitative
an answer data graphs Answer:
Don't know?
2 Categorical data graphs
Quantitative: Discrete or Continuous Bivariate Data: Comparing/Assocation
Terms in this set (38) 3 4
Statistics Variable looking
Science of learning data at a bar chart
in variability
Don't know?
1 Quantitative data graphs 2 Categorical data graphs
Quantitative: Discrete or Continuous Bivariate Data: Comparing/Assocation
Terms in this set (38) 3 4
Population
Statistics Variable Total setof
Science oflearning looking
all individuals
data at a bar chart
inofvariability
interest
Question: Answer:
Don't know?
Quantitative: Discrete or Continuous Bivariate Data: Comparing/Assocation
Terms in this set (38) 3 4
Sample
Population
Statistics Variable Subset
Total of
set individuals
of all looking
selected
individuals
Science of learning data at a barthe
from
inofvariability
interest chart
population
Don't know?
Terms in this set (38)
Parameter
Sample
Population
Statistics Numerical
Subset
Total setofof
Science characteristic
ofindividuals of
selected
all individuals
learning data ainterest
population, a fixed quantity
from the population
inofvariability
Question: Answer:
Don't know?
Terms in this set (38)
Statistic
Parameter
Sample
Population
Statistics Numerical
Subset
Total setofof
Science characteristic
ofindividuals of
selected
all individuals
learning data sample,
ainterest
from the
inofvariability variable
population, quantity
a fixed
populationquantity
Terms in this set (38)
To determine whether a question is statistical, you must be
Statistic
Parameter
Sample
Population Population/subject to be studies
Numerical
Subset
Total setofof characteristic
ofindividuals of
selected
all individuals ainterest
sample,
from the variable
population, quantity
a fixed
populationquantity
Statistics
Question: Science
Answer: learning data inofvariability
able to identify.... Variable/characteristic to be measured
The variation that may occur in the mesurement of the characteristic
To determine whether a question is statistical, you must be
Statistic
Parameter Population/subject
Numerical toselected
characteristicbe studies
sample, variable quantity
Sample
Population
Statistics Subset
Total setofof
Science ofindividuals data of
all individuals
learning ainterest
population,
from the
inofvariability a fixed
populationquantity
able to identify.... Variable/characteristic to be measured
Descriptive Statistics Method
The for organizing
variation & summerizing
that may occur information
in the mesurement of the characteristic
To determine whether a question is statistical, you must be
Statistic
Parameter
Sample
Population Population/subject
Numerical
Subset
Total setofofindividualstoselected
be of
characteristic
all individuals studies
ofainterest
sample, variable
population,
from the quantity
a fixed
populationquantity
Question: Answer:
used with sample data or population
able to identify.... Variable/characteristic to be measured
Descriptive Statistics Method for organizing
The variation & summerizing
that may occur information
in the mesurement of the characteristic
To determine whether a question is statistical, you must be
Statistic
Parameter
Sample Population/subject
Numerical
Subset toselected
of individuals be of
characteristic studies
a sample, variable
population,
from the quantity
a fixed quantity
population
used with sample data or population
able to identify.... Variable/characteristic to be measured
Descriptive Statistics Method
The for organizing
variation & summerizing
that may occur information
in the mesurement of the characteristic
To determine whether a question is statistical, you must be
Statistic
Parameter Population/subject
Numerical to be of
characteristic studies
sample, variable
a population, quantity
a fixed quantity
Question: Answer:
used with sample data or population
able to identify.... Variable/characteristic to be measured
Descriptive Statistics Method
The for organizing
variation & summerizing
that may occur information
in the mesurement of the characteristic
To determine whether a question is statistical, you must be
Statistic Population/subject
Numerical to be of
characteristic studies
a sample, variable quantity
used with sample data or population
able to identify.... Variable/characteristic to be measured
Descriptive Statistics Method for organizing
The variation & summerizing
that may occur information
in the mesurement of the characteristic
To determine whether a question is statistical, you must be Population/subject to be studies
used with sample data or population
able to identify.... Variable/characteristic to be measured
Descriptive Statistics Method
The for organizing
variation & summerizing
that may occur information
in the mesurement of the characteristic
Question: Answer:
used with sample data or population
Descriptive Statistics Method for organizing & summerizing information
used with sample data or population
Question: Answer:
Inferential Statistics Method for drawing conclutions about a population
only used w sample data
estimate
Categorical Variable Non-numerical
y/n
types of pets
Quantitative Variable Numerical Variable
Quantitative: Discrete or Continuous Variable Discrete: value from a set of numbers (Number of)
Continous: Can be a decimal
, Inferential Statistics Method for drawing conclutions about a population
only used w sample data
Question: estimate
Answer:
Inferential Statistics Method for drawing conclutions about a population
only used w sample data
Categorical Variable Non-numerical
estimate
Inferential Statistics Method for drawing conclutions about a population
y/n
only used w sample data
types of pets
Categorical Variable Non-numerical
estimate
Inferential Statistics Method for drawing conclutions about a population
y/n
only used w sample data
Quantitative Variable Numerical Variable
types of pets
Question:
Categorical Variable Answer:
Non-numerical
estimate
Inferential Statistics Method for drawing conclutions about a population
y/n
only used w sample data
Quantitative: Discrete or Continuous Variable
Quantitative Variable Discrete:
Numerical
types value from a set of numbers (Number of)
Variable
of pets
Categorical Variable Non-numerical
estimate
Inferential Statistics Method forCan
Continous: drawing
be a conclutions
decimal about a population
y/n
only used w sample data
Quantitative:Variable
Quantitative Discrete or Continuous Variable Discrete:
Numerical
types value from a set of numbers (Number of)
Variable
of pets
Question:
Categorical Variable Answer:
Non-numerical
estimate
Categorical data: Relative Frequency Distribution
Inferential Statistics Proportion
Method or
forCan
Continous: %beof asomething's
drawing decimal frequency
conclutions (count/total)
about a population
y/n
only used w sample data
Quantitative: Discrete or Continuous Variable
Quantitative Variable Discrete:
Numerical
types value from a set of numbers (Number of)
Variable
of pets
Categorical Variable Non-numerical
estimate
Categorical
Inferential data
data: graphs
Relative Frequency Distribution
Statistics Bar chart,
Proportion
Method pie
for or chart,
% Pareto
of asomething's
drawing
Continous: Can be chartfrequency
conclutions
decimal (count/total)
about a population
y/n
only used w sample data
Quantitative: Discrete or Continuous Variable
Quantitative Variable Discrete:
Numerical
types value from a set of numbers (Number of)
Variable
of pets
Categorical Variable
Quantitative data graphs
Numerical SummaryDistribution Non-numerical
estimate
Mean, Median,
Categorical data
data: Relative Frequency
Inferential Statistics Bar chart,
Proportion
Method pie
for
Continous: or %Mode,
chart, St. Dev,
Pareto
of asomething's
drawing
Can be chart
conclutions
decimal IQR, Range,
frequency
about IQs
(count/total)
a population
Question: Answer:
y/n
only used w sample data
Quantitative:Variable
Quantitative Discrete or Continuous Variable Discrete:
Numerical
types value from a set of numbers (Number of)
Variable
of pets
Categorical
Quantitative Variable
data: StandardFrequency
data graphs
Numericaldeviation
SummaryDistribution Non-numerical
estimate
How
Mean,far orpie
close
Median, the data set isIQR,
from thea mean
Categorical
Inferential data
data: Relative
Statistics Bar chart,
Proportion
Method for
Continous: or %Mode,
chart,
of
drawing
Can be St. Dev,
Pareto
asomething'schart
conclutions
decimal Range,
frequency
about IQs
(count/total)
population
y/n
only used w sample data
Quantitative: Discrete or Continuous Variable
Quantitative Variable Discrete:
Numerical
types value from a set of numbers (Number of)
Variable
of pets
Categorical Variable
Quantitative
Quantitative data
data:
data graphs
StandardFrequency
Numericaldeviation
SummaryDistribution Non-numerical
estimate
Dot
How plot,
Mean,far orbox plot,
close
Median, thehistogram
data set isIQR,
fromRange,
the mean
Categorical data
Question: data: graphs
Relative Bar chart, or %Mode,
pie
Proportion Can
Continous:
Answer: chart,
of
be St. Dev,
Pareto
asomething's
decimal chart frequency IQs
(count/total)
y/n
Quantitative:Variable
Quantitative Discrete or Continuous Variable Discrete:
Numerical
types value from a set of numbers (Number of)
Variable
of pets
Categorical
Quantitative
Quantitative Variable
data:
data:
data SOCS
data graphs
graphs to describe
Standard
Numerical SummaryaDistribution
deviation distribution Non-numerical
Shape:
How
Mean,farunimodal,
Dot chart,
plot,orbox
Median, plot,
close bimodal
thehistogram
data &chart
setSkew,
isIQR,
fromSymetric
the mean
data
Categorical data: Relative Frequency Bar
Proportion
Continous: pie
Can %Mode,
or chart,
of
be St. Dev,
Pareto
asomething's
decimal Range,
frequency IQs
(count/total)
y/n
Outliers
Quantitative: Discrete or Continuous Variable
Quantitative Variable Discrete:
Numerical
types value from a= set
Variable
ofSymmetrical
Center: pets mean of numbers
; Skewed (Number
= median of)
Quantitative data:graphs
data
data:
Quantitative data:
data
data SOCS to describe
graphs
Standard
Numerical SummaryaDistribution
deviation distribution Shape:
Dot
How
Mean,
Bar unimodal,
plot,
far orbox plot,
close
Median,
chart, pie bimodal
the
Mode,
chart, histogram
data &chart
set
St. Dev,
Pareto Skew,
isIQR,
fromSymetric
the mean
Range, IQs
Categorical
Question: Relative Frequency Proportion
Continous:
Answer: or
Can % of
be asomething's
decimal frequency
Spread: Symmetrical = St. Dev ; Skewed = IQR (count/total)
Outliers
Quantitative:Variable
Quantitative Discrete or Continuous Variable Discrete:
Numerical value from a= set
Variable
Center: Symmetrical mean of numbers
; Skewed (Number
= median of)
Quantitative data:
Quantitative data:
Categorical data
data SOCS
data graphs
data: graphs to describe
Standard
Numerical SummaryaDistribution
deviation distribution Shape:
Mean,
Bar farunimodal,
Dot chart,
How plot,orbox plot,
close
Median,
pie bimodal
the
Mode,
chart, histogram
data &chart
set
St. Dev,
Pareto Skew,
isIQR,
fromSymetric
the mean
Range, IQs
Center & Spread Relative
options Frequency Proportion
Continous:
Symmetrical or
Can % of
be asomething's
decimal frequency
Spread: Symmetrical = St. Dev ; Skewed == median
= mean & St. Dev ; Skewed (count/total)
IQR & IQR
Outliers
Quantitative: Discrete or Continuous Variable Discrete: value from a= set
Center: Symmetrical mean of numbers
; Skewed (Number
= median of)
Quantitative
Quantitative
Categorical data:
data
data SOCS
data graphs
data: graphs to describe
Standard
Numerical SummaryaDistribution
deviation distribution Shape:
Mean,
Bar unimodal,
Dot chart,
How plot,
far orbox plot,
close
Median,
pie bimodal
the
Mode,
chart, histogram
data
St.
Pareto &chart
set
Dev,Skew,
is from
IQR, Symetric
the
Range, mean
IQs
Bivariate
Question:
Center data:
& Data
Spread Relative
options Frequency Proportion
Continous:
Analyzing
Answer:
Symmetrical
Spread: or
2Can % of
variables
= mean
Symmetrical something's
be a & decimal
=of
St.interest
St. Dev frequency
Dev ;; Skewed (count/total)
Skewed == median
IQR & IQR
Outliers
Contingency Table
Center: Symmetrical = mean ; Skewed = median
Quantitative data
Quantitative data:graphs
data
data:
data SOCS to describe
graphs
Standard
Numerical SummaryaDistribution
deviation distribution Shape:
Dot
How
Mean,
Bar farunimodal,
plot,orbox plot,
close
Median,
chart, pie bimodal
the
Mode, histogram
data &chart
setSkew,
isIQR,
St.interest
Dev, fromSymetric
the mean
Range, IQs
Categorical
Bivariate
Center data:
& Data
Spread Relative
options Frequency Proportion
Analyzing
Symmetrical
Spread: 2or=chart,
% of
variables
mean
Symmetrical
Pareto
something's
&=of
St.
St. Dev frequency
Dev ;; Skewed
Skewed (count/total)
== median
IQR & IQR
Outliers
Bivariate Data: response & explanatroy variables Response:
Contingency what happens bc of somthing - the columns / x
Table
Center: Symmetrical = mean ; Skewed = median
Quantitative data
Quantitative
Categorical data:graphs
data
data:
data SOCS to describe
graphs
Standard
Numerical Summarya distribution
deviation Shape:
Dot
How
Mean,
Bar farunimodal,
Explanatory:
plot,orbox the
close
Median,
chart, pie bimodal
cause
plot,
the
Mode, - the
histogram
data
St. &chart
set
Dev,Skew,
rows
isIQR,/Symetric
fromy the mean
Range, IQs
Question:
Bivariate
Center & Data
Spread options Answer:
Analyzing
Symmetrical
Spread: =chart,
mean Pareto
2 variables
Symmetrical &=of
St.interest
St. Dev
Dev ;; Skewed
Skewed == median
IQR & IQR
Outliers
Bivariate Data: response & explanatroy variables Response: what
Contingency happens bc of somthing - the columns / x
Table
Center: Symmetrical = mean ; Skewed = median
Quantitative data
Quantitative data: graphs
data
data: SOCS to describe
Standard
Numerical Summarya distribution
deviation Shape:
Dot
How
Mean,farunimodal,
Explanatory:
plot,orbox the
close
Median, bimodal
cause
plot,
the
Mode, - the
histogram
data
St. & Skew,
set
Dev,rows
isIQR,/Symetric
fromy the mean
Range, IQs
Bivariate
Center & Data
Spread options Analyzing
Symmetrical
Spread: 2 variables
= mean &=of
Symmetrical St.interest
St. Dev
Dev ;; Skewed
Skewed == median
IQR & IQR
Outliers
Bivariate Data: response & explanatroy variables Response:
Contingency what happens bc of somthing - the columns / x
Table
Center: Symmetrical = mean ; Skewed = median
Quantitative
Quantitative data: SOCS
data graphs
data: to describe
Standard deviationa distribution Shape:
farunimodal,
Explanatory:
Dot plot,
How orbox the
plot,
close bimodal
cause
the - the
histogram
data & Skew,
setrows /Symetric
is fromy the mean
Question:
Bivariate
Center & Data
Spread options Answer:
Analyzing
Symmetrical
Spread: 2 variables
= mean &=of
Symmetrical St.interest
St. Dev
Dev ;; Skewed
Skewed == median
IQR & IQR
Outliers
Bivariate Data: response & explanatroy variables Response: what
Contingency happens bc of somthing - the columns / x
Table
Center: Symmetrical = mean ; Skewed = median
data: graphs
Quantitative data SOCS to describe a distribution Shape:
Dot unimodal,
Explanatory:
plot, boxthe bimodal
cause
plot, - the
histogram & Skew,
rows /Symetric
y
Bivariate
Center & Data
Spread options Analyzing
Symmetrical
Spread: 2 variables
= mean &=of
Symmetrical St.interest
St. Dev
Dev ;; Skewed
Skewed == median
IQR & IQR
Outliers
Bivariate Data: response & explanatroy variables Response: what
Contingency happens bc of somthing - the columns / x
Table
Center: Symmetrical = mean ; Skewed = median
Quantitative data: SOCS to describe a distribution Shape: unimodal,
Explanatory: bimodal
the cause - the& Skew,
rows /Symetric
y
Bivariate
Center & Data
Spread options Analyzing
Symmetrical
Spread: 2 variables
= mean &=of
Symmetrical St.interest
St. Dev
Dev ;; Skewed
Skewed == median
IQR & IQR
Outliers
Bivariate Data: response & explanatroy variables Response: what
Contingency happens bc of somthing - the columns / x
Table
Center: Symmetrical = mean ; Skewed = median
Explanatory: the cause - the rows / y
Bivariate
Center & Data
Spread options Analyzing
Symmetrical
Spread: 2 variables
= mean &=of
Symmetrical St.interest
St. Dev
Dev ;; Skewed
Skewed == median
IQR & IQR
Question: Answer:
Bivariate Data: response & explanatroy variables Response: what
Contingency happens bc of somthing - the columns / x
Table
Explanatory: the cause - the rows / y
Bivariate
Center & Data
Spread options Analyzing 2 variables
Symmetrical = mean &of
St.interest
Dev ; Skewed = median & IQR
Bivariate Data: response & explanatroy variables Response: what
Contingency happens bc of somthing - the columns / x
Table
Explanatory: the cause - the rows / y
Bivariate Data Analyzing 2 variables of interest
Bivariate Data: response & explanatroy variables Response: what
Contingency happens bc of somthing - the columns / x
Table
Explanatory: the cause - the rows / y
Bivariate Data: response & explanatroy variables Response: what happens bc of somthing - the columns / x
Learn 1 /7 Study with Learn
Choose
1 Quantitative
an answer data graphs 2 Categorical data graphs
Quantitative: Discrete or Continuous Bivariate Data: Comparing/Assocation
Bar3 chart, pie
Variable
chart, Pareto chart 4
looking at a bar chart
Learn 1 /7 Study with Learn
Choose
1 Quantitative
an answer data graphs 2 Categorical data graphs
Quantitative: Discrete or Continuous Bivariate Data: Comparing/Assocation
Bar3 chart, pie chart, Pareto chart 4
STA 261 Exam 1 Review | Questions with 100% Verified Answers |
Choose
1
Variable
Quantitative
an answer data graphs
Don't know?
2
looking at a bar chart
Categorical data graphs
Quantitative: Discrete or Continuous Bivariate Data: Comparing/Assocation
Bar chart, pie chart, Pareto chart
Latest Update 2026/2027
3
Variable
Don't know?
4
looking at a bar chart
Choose
1 Quantitative
an answer data graphs 2 Categorical data graphs
Quantitative: Discrete or Continuous Bivariate Data: Comparing/Assocation
Terms in this set (38) 3 4
Variable looking at a bar chart
Question: Choose
1 Quantitative
an answer data graphs Answer:
Don't know?
2 Categorical data graphs
Quantitative: Discrete or Continuous Bivariate Data: Comparing/Assocation
Terms in this set (38) 3 4
Statistics Variable looking
Science of learning data at a bar chart
in variability
Don't know?
1 Quantitative data graphs 2 Categorical data graphs
Quantitative: Discrete or Continuous Bivariate Data: Comparing/Assocation
Terms in this set (38) 3 4
Population
Statistics Variable Total setof
Science oflearning looking
all individuals
data at a bar chart
inofvariability
interest
Question: Answer:
Don't know?
Quantitative: Discrete or Continuous Bivariate Data: Comparing/Assocation
Terms in this set (38) 3 4
Sample
Population
Statistics Variable Subset
Total of
set individuals
of all looking
selected
individuals
Science of learning data at a barthe
from
inofvariability
interest chart
population
Don't know?
Terms in this set (38)
Parameter
Sample
Population
Statistics Numerical
Subset
Total setofof
Science characteristic
ofindividuals of
selected
all individuals
learning data ainterest
population, a fixed quantity
from the population
inofvariability
Question: Answer:
Don't know?
Terms in this set (38)
Statistic
Parameter
Sample
Population
Statistics Numerical
Subset
Total setofof
Science characteristic
ofindividuals of
selected
all individuals
learning data sample,
ainterest
from the
inofvariability variable
population, quantity
a fixed
populationquantity
Terms in this set (38)
To determine whether a question is statistical, you must be
Statistic
Parameter
Sample
Population Population/subject to be studies
Numerical
Subset
Total setofof characteristic
ofindividuals of
selected
all individuals ainterest
sample,
from the variable
population, quantity
a fixed
populationquantity
Statistics
Question: Science
Answer: learning data inofvariability
able to identify.... Variable/characteristic to be measured
The variation that may occur in the mesurement of the characteristic
To determine whether a question is statistical, you must be
Statistic
Parameter Population/subject
Numerical toselected
characteristicbe studies
sample, variable quantity
Sample
Population
Statistics Subset
Total setofof
Science ofindividuals data of
all individuals
learning ainterest
population,
from the
inofvariability a fixed
populationquantity
able to identify.... Variable/characteristic to be measured
Descriptive Statistics Method
The for organizing
variation & summerizing
that may occur information
in the mesurement of the characteristic
To determine whether a question is statistical, you must be
Statistic
Parameter
Sample
Population Population/subject
Numerical
Subset
Total setofofindividualstoselected
be of
characteristic
all individuals studies
ofainterest
sample, variable
population,
from the quantity
a fixed
populationquantity
Question: Answer:
used with sample data or population
able to identify.... Variable/characteristic to be measured
Descriptive Statistics Method for organizing
The variation & summerizing
that may occur information
in the mesurement of the characteristic
To determine whether a question is statistical, you must be
Statistic
Parameter
Sample Population/subject
Numerical
Subset toselected
of individuals be of
characteristic studies
a sample, variable
population,
from the quantity
a fixed quantity
population
used with sample data or population
able to identify.... Variable/characteristic to be measured
Descriptive Statistics Method
The for organizing
variation & summerizing
that may occur information
in the mesurement of the characteristic
To determine whether a question is statistical, you must be
Statistic
Parameter Population/subject
Numerical to be of
characteristic studies
sample, variable
a population, quantity
a fixed quantity
Question: Answer:
used with sample data or population
able to identify.... Variable/characteristic to be measured
Descriptive Statistics Method
The for organizing
variation & summerizing
that may occur information
in the mesurement of the characteristic
To determine whether a question is statistical, you must be
Statistic Population/subject
Numerical to be of
characteristic studies
a sample, variable quantity
used with sample data or population
able to identify.... Variable/characteristic to be measured
Descriptive Statistics Method for organizing
The variation & summerizing
that may occur information
in the mesurement of the characteristic
To determine whether a question is statistical, you must be Population/subject to be studies
used with sample data or population
able to identify.... Variable/characteristic to be measured
Descriptive Statistics Method
The for organizing
variation & summerizing
that may occur information
in the mesurement of the characteristic
Question: Answer:
used with sample data or population
Descriptive Statistics Method for organizing & summerizing information
used with sample data or population
Question: Answer:
Inferential Statistics Method for drawing conclutions about a population
only used w sample data
estimate
Categorical Variable Non-numerical
y/n
types of pets
Quantitative Variable Numerical Variable
Quantitative: Discrete or Continuous Variable Discrete: value from a set of numbers (Number of)
Continous: Can be a decimal
, Inferential Statistics Method for drawing conclutions about a population
only used w sample data
Question: estimate
Answer:
Inferential Statistics Method for drawing conclutions about a population
only used w sample data
Categorical Variable Non-numerical
estimate
Inferential Statistics Method for drawing conclutions about a population
y/n
only used w sample data
types of pets
Categorical Variable Non-numerical
estimate
Inferential Statistics Method for drawing conclutions about a population
y/n
only used w sample data
Quantitative Variable Numerical Variable
types of pets
Question:
Categorical Variable Answer:
Non-numerical
estimate
Inferential Statistics Method for drawing conclutions about a population
y/n
only used w sample data
Quantitative: Discrete or Continuous Variable
Quantitative Variable Discrete:
Numerical
types value from a set of numbers (Number of)
Variable
of pets
Categorical Variable Non-numerical
estimate
Inferential Statistics Method forCan
Continous: drawing
be a conclutions
decimal about a population
y/n
only used w sample data
Quantitative:Variable
Quantitative Discrete or Continuous Variable Discrete:
Numerical
types value from a set of numbers (Number of)
Variable
of pets
Question:
Categorical Variable Answer:
Non-numerical
estimate
Categorical data: Relative Frequency Distribution
Inferential Statistics Proportion
Method or
forCan
Continous: %beof asomething's
drawing decimal frequency
conclutions (count/total)
about a population
y/n
only used w sample data
Quantitative: Discrete or Continuous Variable
Quantitative Variable Discrete:
Numerical
types value from a set of numbers (Number of)
Variable
of pets
Categorical Variable Non-numerical
estimate
Categorical
Inferential data
data: graphs
Relative Frequency Distribution
Statistics Bar chart,
Proportion
Method pie
for or chart,
% Pareto
of asomething's
drawing
Continous: Can be chartfrequency
conclutions
decimal (count/total)
about a population
y/n
only used w sample data
Quantitative: Discrete or Continuous Variable
Quantitative Variable Discrete:
Numerical
types value from a set of numbers (Number of)
Variable
of pets
Categorical Variable
Quantitative data graphs
Numerical SummaryDistribution Non-numerical
estimate
Mean, Median,
Categorical data
data: Relative Frequency
Inferential Statistics Bar chart,
Proportion
Method pie
for
Continous: or %Mode,
chart, St. Dev,
Pareto
of asomething's
drawing
Can be chart
conclutions
decimal IQR, Range,
frequency
about IQs
(count/total)
a population
Question: Answer:
y/n
only used w sample data
Quantitative:Variable
Quantitative Discrete or Continuous Variable Discrete:
Numerical
types value from a set of numbers (Number of)
Variable
of pets
Categorical
Quantitative Variable
data: StandardFrequency
data graphs
Numericaldeviation
SummaryDistribution Non-numerical
estimate
How
Mean,far orpie
close
Median, the data set isIQR,
from thea mean
Categorical
Inferential data
data: Relative
Statistics Bar chart,
Proportion
Method for
Continous: or %Mode,
chart,
of
drawing
Can be St. Dev,
Pareto
asomething'schart
conclutions
decimal Range,
frequency
about IQs
(count/total)
population
y/n
only used w sample data
Quantitative: Discrete or Continuous Variable
Quantitative Variable Discrete:
Numerical
types value from a set of numbers (Number of)
Variable
of pets
Categorical Variable
Quantitative
Quantitative data
data:
data graphs
StandardFrequency
Numericaldeviation
SummaryDistribution Non-numerical
estimate
Dot
How plot,
Mean,far orbox plot,
close
Median, thehistogram
data set isIQR,
fromRange,
the mean
Categorical data
Question: data: graphs
Relative Bar chart, or %Mode,
pie
Proportion Can
Continous:
Answer: chart,
of
be St. Dev,
Pareto
asomething's
decimal chart frequency IQs
(count/total)
y/n
Quantitative:Variable
Quantitative Discrete or Continuous Variable Discrete:
Numerical
types value from a set of numbers (Number of)
Variable
of pets
Categorical
Quantitative
Quantitative Variable
data:
data:
data SOCS
data graphs
graphs to describe
Standard
Numerical SummaryaDistribution
deviation distribution Non-numerical
Shape:
How
Mean,farunimodal,
Dot chart,
plot,orbox
Median, plot,
close bimodal
thehistogram
data &chart
setSkew,
isIQR,
fromSymetric
the mean
data
Categorical data: Relative Frequency Bar
Proportion
Continous: pie
Can %Mode,
or chart,
of
be St. Dev,
Pareto
asomething's
decimal Range,
frequency IQs
(count/total)
y/n
Outliers
Quantitative: Discrete or Continuous Variable
Quantitative Variable Discrete:
Numerical
types value from a= set
Variable
ofSymmetrical
Center: pets mean of numbers
; Skewed (Number
= median of)
Quantitative data:graphs
data
data:
Quantitative data:
data
data SOCS to describe
graphs
Standard
Numerical SummaryaDistribution
deviation distribution Shape:
Dot
How
Mean,
Bar unimodal,
plot,
far orbox plot,
close
Median,
chart, pie bimodal
the
Mode,
chart, histogram
data &chart
set
St. Dev,
Pareto Skew,
isIQR,
fromSymetric
the mean
Range, IQs
Categorical
Question: Relative Frequency Proportion
Continous:
Answer: or
Can % of
be asomething's
decimal frequency
Spread: Symmetrical = St. Dev ; Skewed = IQR (count/total)
Outliers
Quantitative:Variable
Quantitative Discrete or Continuous Variable Discrete:
Numerical value from a= set
Variable
Center: Symmetrical mean of numbers
; Skewed (Number
= median of)
Quantitative data:
Quantitative data:
Categorical data
data SOCS
data graphs
data: graphs to describe
Standard
Numerical SummaryaDistribution
deviation distribution Shape:
Mean,
Bar farunimodal,
Dot chart,
How plot,orbox plot,
close
Median,
pie bimodal
the
Mode,
chart, histogram
data &chart
set
St. Dev,
Pareto Skew,
isIQR,
fromSymetric
the mean
Range, IQs
Center & Spread Relative
options Frequency Proportion
Continous:
Symmetrical or
Can % of
be asomething's
decimal frequency
Spread: Symmetrical = St. Dev ; Skewed == median
= mean & St. Dev ; Skewed (count/total)
IQR & IQR
Outliers
Quantitative: Discrete or Continuous Variable Discrete: value from a= set
Center: Symmetrical mean of numbers
; Skewed (Number
= median of)
Quantitative
Quantitative
Categorical data:
data
data SOCS
data graphs
data: graphs to describe
Standard
Numerical SummaryaDistribution
deviation distribution Shape:
Mean,
Bar unimodal,
Dot chart,
How plot,
far orbox plot,
close
Median,
pie bimodal
the
Mode,
chart, histogram
data
St.
Pareto &chart
set
Dev,Skew,
is from
IQR, Symetric
the
Range, mean
IQs
Bivariate
Question:
Center data:
& Data
Spread Relative
options Frequency Proportion
Continous:
Analyzing
Answer:
Symmetrical
Spread: or
2Can % of
variables
= mean
Symmetrical something's
be a & decimal
=of
St.interest
St. Dev frequency
Dev ;; Skewed (count/total)
Skewed == median
IQR & IQR
Outliers
Contingency Table
Center: Symmetrical = mean ; Skewed = median
Quantitative data
Quantitative data:graphs
data
data:
data SOCS to describe
graphs
Standard
Numerical SummaryaDistribution
deviation distribution Shape:
Dot
How
Mean,
Bar farunimodal,
plot,orbox plot,
close
Median,
chart, pie bimodal
the
Mode, histogram
data &chart
setSkew,
isIQR,
St.interest
Dev, fromSymetric
the mean
Range, IQs
Categorical
Bivariate
Center data:
& Data
Spread Relative
options Frequency Proportion
Analyzing
Symmetrical
Spread: 2or=chart,
% of
variables
mean
Symmetrical
Pareto
something's
&=of
St.
St. Dev frequency
Dev ;; Skewed
Skewed (count/total)
== median
IQR & IQR
Outliers
Bivariate Data: response & explanatroy variables Response:
Contingency what happens bc of somthing - the columns / x
Table
Center: Symmetrical = mean ; Skewed = median
Quantitative data
Quantitative
Categorical data:graphs
data
data:
data SOCS to describe
graphs
Standard
Numerical Summarya distribution
deviation Shape:
Dot
How
Mean,
Bar farunimodal,
Explanatory:
plot,orbox the
close
Median,
chart, pie bimodal
cause
plot,
the
Mode, - the
histogram
data
St. &chart
set
Dev,Skew,
rows
isIQR,/Symetric
fromy the mean
Range, IQs
Question:
Bivariate
Center & Data
Spread options Answer:
Analyzing
Symmetrical
Spread: =chart,
mean Pareto
2 variables
Symmetrical &=of
St.interest
St. Dev
Dev ;; Skewed
Skewed == median
IQR & IQR
Outliers
Bivariate Data: response & explanatroy variables Response: what
Contingency happens bc of somthing - the columns / x
Table
Center: Symmetrical = mean ; Skewed = median
Quantitative data
Quantitative data: graphs
data
data: SOCS to describe
Standard
Numerical Summarya distribution
deviation Shape:
Dot
How
Mean,farunimodal,
Explanatory:
plot,orbox the
close
Median, bimodal
cause
plot,
the
Mode, - the
histogram
data
St. & Skew,
set
Dev,rows
isIQR,/Symetric
fromy the mean
Range, IQs
Bivariate
Center & Data
Spread options Analyzing
Symmetrical
Spread: 2 variables
= mean &=of
Symmetrical St.interest
St. Dev
Dev ;; Skewed
Skewed == median
IQR & IQR
Outliers
Bivariate Data: response & explanatroy variables Response:
Contingency what happens bc of somthing - the columns / x
Table
Center: Symmetrical = mean ; Skewed = median
Quantitative
Quantitative data: SOCS
data graphs
data: to describe
Standard deviationa distribution Shape:
farunimodal,
Explanatory:
Dot plot,
How orbox the
plot,
close bimodal
cause
the - the
histogram
data & Skew,
setrows /Symetric
is fromy the mean
Question:
Bivariate
Center & Data
Spread options Answer:
Analyzing
Symmetrical
Spread: 2 variables
= mean &=of
Symmetrical St.interest
St. Dev
Dev ;; Skewed
Skewed == median
IQR & IQR
Outliers
Bivariate Data: response & explanatroy variables Response: what
Contingency happens bc of somthing - the columns / x
Table
Center: Symmetrical = mean ; Skewed = median
data: graphs
Quantitative data SOCS to describe a distribution Shape:
Dot unimodal,
Explanatory:
plot, boxthe bimodal
cause
plot, - the
histogram & Skew,
rows /Symetric
y
Bivariate
Center & Data
Spread options Analyzing
Symmetrical
Spread: 2 variables
= mean &=of
Symmetrical St.interest
St. Dev
Dev ;; Skewed
Skewed == median
IQR & IQR
Outliers
Bivariate Data: response & explanatroy variables Response: what
Contingency happens bc of somthing - the columns / x
Table
Center: Symmetrical = mean ; Skewed = median
Quantitative data: SOCS to describe a distribution Shape: unimodal,
Explanatory: bimodal
the cause - the& Skew,
rows /Symetric
y
Bivariate
Center & Data
Spread options Analyzing
Symmetrical
Spread: 2 variables
= mean &=of
Symmetrical St.interest
St. Dev
Dev ;; Skewed
Skewed == median
IQR & IQR
Outliers
Bivariate Data: response & explanatroy variables Response: what
Contingency happens bc of somthing - the columns / x
Table
Center: Symmetrical = mean ; Skewed = median
Explanatory: the cause - the rows / y
Bivariate
Center & Data
Spread options Analyzing
Symmetrical
Spread: 2 variables
= mean &=of
Symmetrical St.interest
St. Dev
Dev ;; Skewed
Skewed == median
IQR & IQR
Question: Answer:
Bivariate Data: response & explanatroy variables Response: what
Contingency happens bc of somthing - the columns / x
Table
Explanatory: the cause - the rows / y
Bivariate
Center & Data
Spread options Analyzing 2 variables
Symmetrical = mean &of
St.interest
Dev ; Skewed = median & IQR
Bivariate Data: response & explanatroy variables Response: what
Contingency happens bc of somthing - the columns / x
Table
Explanatory: the cause - the rows / y
Bivariate Data Analyzing 2 variables of interest
Bivariate Data: response & explanatroy variables Response: what
Contingency happens bc of somthing - the columns / x
Table
Explanatory: the cause - the rows / y
Bivariate Data: response & explanatroy variables Response: what happens bc of somthing - the columns / x


