
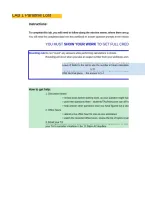
LAB 1 Paradise Lost
Instructions:
To complete this lab, you will need to follow along the mission memo, where there are guided video tuto
You will need the completed data from this workbook to answer question prompts in the mission memo. The an
YOU MUST SHOW YOUR WORK TO GET FULL CREDIT
Rounding rule Do not "round" any answers while performing calculations in sheets.
Rounding will occur when you take an output number from your workbook and answer a questio
For example if your workbook has a number in cell E14 that is the output of a ca
Leave it! Refer to the cell to use the number in future calculations.
5.37
If you are asked, what is the value of E14 in your memo or quiz, THEN round yo
ONE decimal place.... the answer is 5.4
How to get help:
1. Discussion board
> review posts before starting work, as your question might have been answere
> post new questions there - students/TAs/instructors can all help to answer qu
> help answer other questions once you have figured out a strategy!
2. Office hours
> attend a live office hour for one-on-one assistance
> watch the recorded office hours, review the list of topics covered if you get stu
4. If you have technical difficulties while submitting answers from your Mission Memo to the
3. Email Quiz,
Canvas your TA
please use the Submission Comment box to upload a file or add a comment for
your TA to consider >>before<< the 11:59pm AZ deadline
, here are guided video tutorials
n the mission memo. The answers to those question prompts will be input in your Canvas quiz.
L CREDIT
kbook and answer a question in your memo
E14 that is the output of a calculation.
e calculations.
emo or quiz, THEN round your number to
n might have been answered!
rs can all help to answer queries
ed out a strategy!
topics covered if you get stuck
our Mission Memo to the
a file or add a comment for
, GOAL: Calculate the probability that the cadmium concentration in water exceeds the recom
Plot a Frequency distribution of Cadmium concentra
Sample number Concentration of Cd (mg L-1) Histogram bins Frequency
1 312 120 1
2 250 160 1
3 399 200 3
4 144 240 3
5 294 280 4
6 224 320 5
7 225 360 0
8 511 400 2
9 199 440 0
10 282 480 0
11 185 520 1
12 363 0
13 277
14 191 Use the normal probability distribution to estimate th
15 251
16 287 mean 264
17 208
18 277 standard deviation 90.053380238
19 110
20 282 probability density function (the probability of the value o
0.9652949665


