Virtual Laboratory Activity - BIOL 1121 - Unit 7
Data Collection and Result
While you are working on this virtual lab activity, please record your data in the tables
below.
1) Data Collection Tables
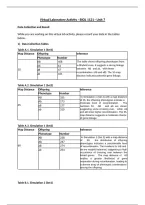
Table A.1. Simulation 1 (Set1)
Map Distance Offspring Inference
Phenotype Number
AB 458 The table shows offspring phenotypes from
Ab 61 a dihybrid cross. It suggests a strong linkage
10 aB 47 between AB and ab, with fewer
recombination (Ab and aB). The 10-map
ab 431
distance indicates potential gene linkage.
Table A.2. Simulation 1 (Set2)
Map Distance Offspring Inference
Phenotype Number
AB 335 In Simulation 1 (Set 2) with a map distance
of 35, the offspring phenotypes indicate a
Ab 173
moderate level of recombination. The
35 aB 177 numbers for AB and ab are closer,
ab 310 suggesting some crossing over, while Ab
and aB show higher recombination. The 35-
map distance suggests a moderate chance
of gene linkage.
Table A.3. Simulation 1 (Set3)
Map Distance Offspring Inference
Phenotype Number
AB 238 In Simulation 1 (Set 3) with a map distance
of 60, the distribution of offspring
Ab 247
phenotypes indicates a considerable level
60 aB 274 of recombination. The numbers for AB and
ab 254 ab are roughly balanced, suggesting a high
occurrence of crossing over between the
linked genes. The map distance of 60
implies a greater likelihood of gene
separation during recombination, leading to
a diverse array of phenotypic combinations
among the offspring.
Table B.1. Simulation 2 (Set1)
, Map Distance Offspring Inference
Phenotype Number
AB 715 At a map distance of 10, a majority of
Ab 41 offspring exhibit the non-crossover
phenotype (AB), indicating a strong
10 aB 46 linkage between the genes. Recombinant
ab 189 phenotypes (Ab and aB) are less prevalent,
suggesting limited crossing over and
reinforcing the close proximity of these
genes on the chromosome.
Table B.2. Simulation 2 (Set2)
Map Distance Offspring Inference
Phenotype Number
AB 586 At a map distance of 35, the majority
Ab 135 of offspring display the non-crossover
phenotype (AB), suggesting a strong
35 aB 153 linkage between the genes.
ab 94 Recombinant phenotypes (Ab and
aB) are present but less frequent,
indicating limited crossing over. The
relatively low number of double
crossover offspring (ab) further
supports the close proximity of these
genes on the chromosome.
Table B.3. Simulation 2 (Set3)
Map Distance Offspring Inference
Phenotype Number
AB 541 At a map distance of 60, the
Ab 187 predominant phenotype is non-
crossover (AB), suggesting a strong
60 aB 171 linkage between the genes.
ab 49 Recombinant phenotypes (Ab and
aB) are present but not as frequently,
indicating some crossing over. The
double crossover phenotype (ab) is
notably lower in number, supporting
the idea of genes being relatively
close on the chromosome with
limited recombination events.
2- Question