
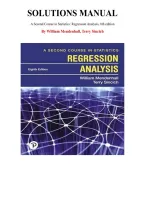
SOLUTIONS MANUAL
A Second Course in Statistics: Regression Analysis, 8th edition
By William Mendenhall, Terry Sincich
TU
TO
R
G
U
R
U
, TABLE OF CONTENT
1. A Review of Basic Concepts (Optional)
1.1 Statistics and Data
1.2 Populations, Samples, and Random Sampling
1.3 Describing Qualitative Data
1.4 Describing Quantitative Data Graphically
1.5 Describing Quantitative Data Numerically
1.6 The Normal Probability Distribution
1.7 Sampling Distributions and the Central Limit Theorem
1.8 Estimating a Population Mean
1.9 Testing a Hypothesis About a Population Mean
1.10 Inferences About the Difference Between Two Population Means
TU
1.11 Comparing Two Population Variances
2. Introduction to Regression Analysis
2.1 Modeling a Response
2.2 Overview of Regression Analysis
2.3 Regression Applications
2.4 Collecting the Data for Regression
3. Simple Linear Regression
TO
3.1 Introduction
3.2 The Straight-Line Probabilistic Model
3.3 Fitting the Model: The Method of Least Squares
3.4 Model Assumptions
3.5 An Estimator of σ2
3.6 Assessing the Utility of the Model: Making Inferences About the Slope β1
R
3.7 The Coefficient of Correlation
3.8 The Coefficient of Determination
3.9 Using the Model for Estimation and Prediction
G
3.10 A Complete Example
3.11 Regression Through the Origin (Optional)
Case Study 1: Legal Advertising–Does It Pay?
4. Multiple Regression Models
U
4.1 General Form of a Multiple Regression Model
4.2 Model Assumptions
4.3 A First-Order Model with Quantitative Predictors
R
4.4 Fitting the Model: The Method of Least Squares
4.5 Estimation of σ2, the Variance of ε
4.6 Testing Overall Model Utility: The Analysis of Variance F-Test
U
4.7 Inferences About the Individual β Parameters
4.8 Multiple Coefficients of Determination: R2 and R2adj
4.9 Using the Model for Estimation and Prediction
4.10 An Interaction Model with Quantitative Predictors
4.11 A Quadratic (Second-Order) Model with a Quantitative Predictor
4.12 More Complex Multiple Regression Models (Optional)
4.13 A Test for Comparing Nested Models
4.14 A Complete Example
Case Study 2: Modeling the Sale Prices of Residential Properties in Four Neighborhoods
5. Principles of Model-Building
5.1 Introduction: Why Model Building is Important
5.2 The Two Types of Independent Variables: Quantitative and Qualitative
,5.3 Models with a Single Quantitative Independent Variable
5.4 First-Order Models with Two or More Quantitative Independent Variables
5.5 Second-Order Models with Two or More Quantitative Independent Variables
5.6 Coding Quantitative Independent Variables (Optional)
5.7 Models with One Qualitative Independent Variable
5.8 Models with Two Qualitative Independent Variables
5.9 Models with Three or More Qualitative Independent Variables
5.10 Models with Both Quantitative and Qualitative Independent Variables
5.11 External Model Validation
6. Variable Screening Methods
6.1 Introduction: Why Use a Variable-Screening Method?
TU
6.2 Stepwise Regression
6.3 All-Possible-Regressions-Selection Procedure
6.4 Caveats
Case Study 3: Deregulation of the Intrastate Trucking Industry
7. Some Regression Pitfalls
TO
7.1 Introduction
7.2 Observational Data Versus Designed Experiments
7.3 Parameter Estimability and Interpretation
7.4 Multicollinearity
7.5 Extrapolation: Predicting Outside the Experimental Region
R
7.6 Variable Transformations
8. Residual Analysis
8.1 Introduction
G
8.2 Plotting Residuals and Detecting Lack of Fit
8.3 Detecting Unequal Variances
8.4 Checking the Normality Assumption
U
8.5 Detecting Outliers and Identifying Influential Observations
8.6 Detection of Residual Correlation: The Durbin-Watson Test
Case Study 4: An Analysis of Rain Levels in California
R
Case Study 5: Factors Affecting the Sale Price of Condominium Units Sold at Public Auction
9. Special Topics in Regression (Optional)
U
9.1 Introduction
9.2 Piecewise Linear Regression
9.3 Inverse Prediction
9.4 Weighted Least Squares
9.5 Modeling Qualitative Dependent Variables
9.6 Logistic Regression
9.7 Poisson Regression
9.8 Ridge and Lasso Regression
9.9 Robust Regression
9.10 Nonparametric Regression Models
, 10. Time Series Modeling and Forecasting
10.1 What is a Time Series?
10.2 Time Series Components
10.3 Forecasting Using Smoothing Techniques (Optional)
10.4 Forecasting: The Regression Approach
10.5 Autocorrelation and Autoregressive Error Models
10.6 Other Models for Autocorrelated Errors (Optional)
10.7 Constructing Time Series Models
10.8 Fitting Time Series Models with Autoregressive Errors
10.9 Forecasting with Time Series Autoregressive Models
10.10 Seasonal Time Series Models: An Example
TU
10.11 Forecasting Using Lagged Values of the Dependent Variable (Optional)
Case Study 6: Modeling Daily Peak Electricity Demands
11. Principles of Experimental Design
11.1 Introduction
11.2 Experimental Design Terminology
TO
11.3 Controlling the Information in an Experiment
11.4 Noise-Reducing Designs
11.5 Volume-Increasing Designs
11.6 Selecting the Sample Size
11.7 The Importance of Randomization
R
12. The Analysis of Variance for Designed Experiments
12.1 Introduction
12.2 The Logic Behind an Analysis of Variance
G
12.3 One-Factor Completely Randomized Designs
12.4 Randomized Block Designs
12.5 Two-Factor Factorial Experiments
U
12.6 More Complex Factorial Designs (Optional)
12.7 Follow-Up Analysis: Tukey's Multiple Comparisons of Means
12.8 Other Multiple Comparisons Methods (Optional)
R
12.9 Checking ANOVA Assumptions
Case Study 7: Voice Versus Face Recognition -- Does One Follow the Other?
U
A Second Course in Statistics: Regression Analysis, 8th edition
By William Mendenhall, Terry Sincich
TU
TO
R
G
U
R
U
, TABLE OF CONTENT
1. A Review of Basic Concepts (Optional)
1.1 Statistics and Data
1.2 Populations, Samples, and Random Sampling
1.3 Describing Qualitative Data
1.4 Describing Quantitative Data Graphically
1.5 Describing Quantitative Data Numerically
1.6 The Normal Probability Distribution
1.7 Sampling Distributions and the Central Limit Theorem
1.8 Estimating a Population Mean
1.9 Testing a Hypothesis About a Population Mean
1.10 Inferences About the Difference Between Two Population Means
TU
1.11 Comparing Two Population Variances
2. Introduction to Regression Analysis
2.1 Modeling a Response
2.2 Overview of Regression Analysis
2.3 Regression Applications
2.4 Collecting the Data for Regression
3. Simple Linear Regression
TO
3.1 Introduction
3.2 The Straight-Line Probabilistic Model
3.3 Fitting the Model: The Method of Least Squares
3.4 Model Assumptions
3.5 An Estimator of σ2
3.6 Assessing the Utility of the Model: Making Inferences About the Slope β1
R
3.7 The Coefficient of Correlation
3.8 The Coefficient of Determination
3.9 Using the Model for Estimation and Prediction
G
3.10 A Complete Example
3.11 Regression Through the Origin (Optional)
Case Study 1: Legal Advertising–Does It Pay?
4. Multiple Regression Models
U
4.1 General Form of a Multiple Regression Model
4.2 Model Assumptions
4.3 A First-Order Model with Quantitative Predictors
R
4.4 Fitting the Model: The Method of Least Squares
4.5 Estimation of σ2, the Variance of ε
4.6 Testing Overall Model Utility: The Analysis of Variance F-Test
U
4.7 Inferences About the Individual β Parameters
4.8 Multiple Coefficients of Determination: R2 and R2adj
4.9 Using the Model for Estimation and Prediction
4.10 An Interaction Model with Quantitative Predictors
4.11 A Quadratic (Second-Order) Model with a Quantitative Predictor
4.12 More Complex Multiple Regression Models (Optional)
4.13 A Test for Comparing Nested Models
4.14 A Complete Example
Case Study 2: Modeling the Sale Prices of Residential Properties in Four Neighborhoods
5. Principles of Model-Building
5.1 Introduction: Why Model Building is Important
5.2 The Two Types of Independent Variables: Quantitative and Qualitative
,5.3 Models with a Single Quantitative Independent Variable
5.4 First-Order Models with Two or More Quantitative Independent Variables
5.5 Second-Order Models with Two or More Quantitative Independent Variables
5.6 Coding Quantitative Independent Variables (Optional)
5.7 Models with One Qualitative Independent Variable
5.8 Models with Two Qualitative Independent Variables
5.9 Models with Three or More Qualitative Independent Variables
5.10 Models with Both Quantitative and Qualitative Independent Variables
5.11 External Model Validation
6. Variable Screening Methods
6.1 Introduction: Why Use a Variable-Screening Method?
TU
6.2 Stepwise Regression
6.3 All-Possible-Regressions-Selection Procedure
6.4 Caveats
Case Study 3: Deregulation of the Intrastate Trucking Industry
7. Some Regression Pitfalls
TO
7.1 Introduction
7.2 Observational Data Versus Designed Experiments
7.3 Parameter Estimability and Interpretation
7.4 Multicollinearity
7.5 Extrapolation: Predicting Outside the Experimental Region
R
7.6 Variable Transformations
8. Residual Analysis
8.1 Introduction
G
8.2 Plotting Residuals and Detecting Lack of Fit
8.3 Detecting Unequal Variances
8.4 Checking the Normality Assumption
U
8.5 Detecting Outliers and Identifying Influential Observations
8.6 Detection of Residual Correlation: The Durbin-Watson Test
Case Study 4: An Analysis of Rain Levels in California
R
Case Study 5: Factors Affecting the Sale Price of Condominium Units Sold at Public Auction
9. Special Topics in Regression (Optional)
U
9.1 Introduction
9.2 Piecewise Linear Regression
9.3 Inverse Prediction
9.4 Weighted Least Squares
9.5 Modeling Qualitative Dependent Variables
9.6 Logistic Regression
9.7 Poisson Regression
9.8 Ridge and Lasso Regression
9.9 Robust Regression
9.10 Nonparametric Regression Models
, 10. Time Series Modeling and Forecasting
10.1 What is a Time Series?
10.2 Time Series Components
10.3 Forecasting Using Smoothing Techniques (Optional)
10.4 Forecasting: The Regression Approach
10.5 Autocorrelation and Autoregressive Error Models
10.6 Other Models for Autocorrelated Errors (Optional)
10.7 Constructing Time Series Models
10.8 Fitting Time Series Models with Autoregressive Errors
10.9 Forecasting with Time Series Autoregressive Models
10.10 Seasonal Time Series Models: An Example
TU
10.11 Forecasting Using Lagged Values of the Dependent Variable (Optional)
Case Study 6: Modeling Daily Peak Electricity Demands
11. Principles of Experimental Design
11.1 Introduction
11.2 Experimental Design Terminology
TO
11.3 Controlling the Information in an Experiment
11.4 Noise-Reducing Designs
11.5 Volume-Increasing Designs
11.6 Selecting the Sample Size
11.7 The Importance of Randomization
R
12. The Analysis of Variance for Designed Experiments
12.1 Introduction
12.2 The Logic Behind an Analysis of Variance
G
12.3 One-Factor Completely Randomized Designs
12.4 Randomized Block Designs
12.5 Two-Factor Factorial Experiments
U
12.6 More Complex Factorial Designs (Optional)
12.7 Follow-Up Analysis: Tukey's Multiple Comparisons of Means
12.8 Other Multiple Comparisons Methods (Optional)
R
12.9 Checking ANOVA Assumptions
Case Study 7: Voice Versus Face Recognition -- Does One Follow the Other?
U


