
xxx
Multiple Choice Questions (30 marks)
Question 1.
Which of the following cannot be obtained from the box-and-whisker
diagram directly?
I. The mode
II. The variance
III. The lower-quartile
A. I and II only
B. I and III only
C. II and III only
D. I, II and III
Question 2.
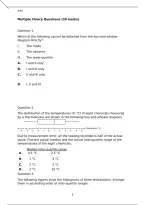
The distribution of the temperatures (in °C) of eight chemicals measured
by a thermometer are shown in the following box-and-whisker diagram.
Due to measurement error, all the reading recorded is half of the actual
value. Find the actual median and the actual inter-quartile range of the
temperatures of the eight chemicals.
Median Inter-quartile range
A. 0.5 °C 2.5 °C
B. 1 °C 5 °C
C. 2 °C 2 °C
D. 2 °C 10 °C
Question 3.
The following figures show the histograms of three distributions. Arrange
them in ascending order of inter-quartile ranges.
1
,xxx
I.
II.
III.
A. I, II, III
B. I, III, II
C. II, I, III
D. II, III, I
2
, xxx
Question 4.
Find the standard deviation of the data set {8, 4, 5, 6, 12}.
(Give your answer correct to 3 significant figures.)
A. 2.83
B. 7.00
C. 7.95
D. 5.13
Question 5.
Find the standard deviation of the data set {5.2, 5.7, 5.9, 7.2, 8.5, 6.5}.
(Give your answer correct to 3 significant figures.)
A. 0.54
B. 1.09
C. 1.20
D. 1.34
Question 6.
Find the standard deviation of the following distribution.
(Give your answer correct to 3 significant figures.)
Data 10 11 12 13
Frequen 8 7 6 4
cy
A. 1.03
B. 1.05
C. 1.07
3


