
LVL7 NSC 2026
S T U DY PACKS CAPS
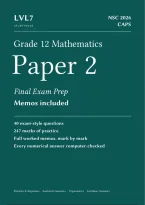
Grade 12 Mathematics
Paper 2
Final Exam Prep
Memos included
40 exam-style questions
247 marks of practice
Full worked memos, mark by mark
Every numerical answer computer-checked
Statistics & Regression ⋅ Analytical Geometry ⋅ Trigonometry ⋅ Euclidean Geometry
,LVL7 Grade 12 Mathematics ⋅ Paper 2 How the memos work
INSIDE THE PACK
How the worked memos work
Every question in this pack has a worked memo laid out like the one below: the working an examiner
expects, a tick 3 beside each line that earns a mark, and the mark allocation underneath. This is
question T11, exactly as it appears in Topic 3.
THE QUESTION
T11 Trig graphs from Topic 3, page 11
The graphs of 𝑓 (𝑥) = cos 2𝑥 and 𝑔(𝑥) = sin(𝑥 + 30∘ ) are drawn below for 𝑥 ∈ [−180∘ ; 180∘ ].
(a) Write down the period of 𝑓 and the range of 𝑔. (2)
(b) Calculate the 𝑥-coordinates of the points where 𝑓 and 𝑔 intersect in the given interval. (5)
(c) For which values of 𝑥, 𝑥 ∈ [0∘ ; 180∘ ], is 𝑓 (𝑥) ⋅ 𝑔(𝑥) < 0? (2)
[9]
f(x) = cos 2x g(x) = sin(x + 30 ∘ )
1.0
0.5
−0.5
−1.0
-180° -135° -90° -45° 0° 45° 90° 135° 180°
THE WORKED MEMO
T11 Trig graphs memo page 26
(a) Period of 𝑓 = 180∘ 3 Range of 𝑔: [−1; 1] 3
(b) cos 2𝑥 = sin(𝑥 + 30∘ ) = cos(60∘ − 𝑥) 3
2𝑥 = 60∘ − 𝑥 + 𝑘 ⋅ 360∘ ⇒ 𝑥 = 20∘ + 𝑘 ⋅ 120∘ 3
2𝑥 = 𝑥 − 60∘ + 𝑘 ⋅ 360∘ ⇒ 𝑥 = −60∘ + 𝑘 ⋅ 360∘ 3
In [−180∘ ; 180∘ ]: 𝑥 ∈ {−100∘ ; −60∘ ; 20∘ ; 140∘ } 33
(c) 𝑓 < 0 and 𝑔 > 0 for 45∘ < 𝑥 < 135∘ ; 𝑓 > 0 and 𝑔 < 0 for 150∘ < 𝑥 ≤ 180∘ .
𝑥 ∈ (45∘ ; 135∘ ) ∪ (150∘ ; 180∘ ] 33
Mark allocation (a) 1 each; (b) 1 co-function, 1 each general case, 2 values in interval; (c) 1 each interval Total 9
© 2026 LVL7 Study Packs ⋅ Licensed for one learner’s personal use. Do not share or resell. 2
,LVL7 Grade 12 Mathematics ⋅ Paper 2 Contents
GRADE 12 MATHEMATICS ⋅ PAPER 2 FINAL EXAM PREP
Contents
40 247 4 100%
original exam-style marks, NSC-style topics, in exam order of questions with a worked
questions allocation memo
Topic Questions No. Marks Questions Memo
page page
1 Statistics & Regression S1–S5 5 38 4 18
2 Analytical Geometry G1–G11 11 65 7 21
3 Trigonometry T1–T14 14 83 9 24
4 Euclidean Geometry E1–E10 10 61 13 28
Total 40 247
How the worked memos are marked (a real question from this pack) 2
How to use this pack, exam conventions, about this pack 31
Mark Tracker and NSC level calculator 32
What is in this pack Who it is for
• 40 original questions (no recycled • Learners: exam-style practice by topic,
past-paper questions), 247 marks (more timed by the marks, with memos you can
than one and a half full Paper 2s’ worth of mark yourself against.
practice) • Parents: a complete, self-marking pack.
• All four Paper 2 topics, in the order and Every question has a worked memo, and the
style of the NSC paper Mark Tracker turns scores into an NSC
• A topic toolkit of must-know facts and level.
methods before each topic • Tutors: original questions with NSC-style
• A worked memo for every question, with mark allocations, and question and memo
the tick-by-tick mark allocation page references for every item.
• Diagrams for every geometry and graph
question
• Every numerical answer re-checked by
computer before publication (page 31)
• A Mark Tracker that converts your score
into an NSC level
© 2026 LVL7 Study Packs ⋅ Licensed for one learner’s personal use. Do not share or resell. 3
,PART A ⋅ TOPIC 1
Statistics & Regression
5 questions ⋅ 38 marks ⋅ about 46 minutes
Questions S1–S5 ⋅ worked memo for this topic starts on page 18
TOPIC TOOLKIT
• Median position 𝑛+1
2
; 𝑄1 = median of the lower half, 𝑄3 = median of the upper half. IQR = 𝑄3 −𝑄1 .
• Five-number summary: (minimum; 𝑄1 ; median; 𝑄3 ; maximum). Outliers lie below 𝑄1 − 1,5×IQR
or above 𝑄3 + 1,5×IQR.
∑(𝑥 − 𝑥)̄ 2
• Standard deviation (NSC uses the population formula): 𝜎 = . Use the STAT mode of
√ 𝑛
your calculator.
• Adding 𝑘 to every value adds 𝑘 to the mean and leaves 𝜎 unchanged. Multiplying every value by
𝑘 multiplies both by 𝑘.
∑ 𝑓 ⋅ (midpoint)
• Grouped data: estimated mean = . An ogive plots cumulative frequency against
𝑛
the upper class boundary.
• Least-squares line 𝑦̂ = 𝑎 + 𝑏𝑥 and correlation 𝑟 from the calculator (A+BX mode). |𝑟| close to 1 =
strong.
S1 Five-number summary and box plot memo p. 18
The Maths test marks (out of 100) of 15 learners are:
34 41 45 48 52 55 55 58 61 63 67 70 74 79 88
(a) Calculate the mean mark. (2)
(b) Write down the five-number summary. (3)
(c) Show that the data has no outliers. (2)
(d) Draw a box-and-whisker diagram and comment on the skewness of the data. (2)
[9]
© 2026 LVL7 Study Packs ⋅ Licensed for one learner’s personal use. Do not share or resell. 4
S T U DY PACKS CAPS
Grade 12 Mathematics
Paper 2
Final Exam Prep
Memos included
40 exam-style questions
247 marks of practice
Full worked memos, mark by mark
Every numerical answer computer-checked
Statistics & Regression ⋅ Analytical Geometry ⋅ Trigonometry ⋅ Euclidean Geometry
,LVL7 Grade 12 Mathematics ⋅ Paper 2 How the memos work
INSIDE THE PACK
How the worked memos work
Every question in this pack has a worked memo laid out like the one below: the working an examiner
expects, a tick 3 beside each line that earns a mark, and the mark allocation underneath. This is
question T11, exactly as it appears in Topic 3.
THE QUESTION
T11 Trig graphs from Topic 3, page 11
The graphs of 𝑓 (𝑥) = cos 2𝑥 and 𝑔(𝑥) = sin(𝑥 + 30∘ ) are drawn below for 𝑥 ∈ [−180∘ ; 180∘ ].
(a) Write down the period of 𝑓 and the range of 𝑔. (2)
(b) Calculate the 𝑥-coordinates of the points where 𝑓 and 𝑔 intersect in the given interval. (5)
(c) For which values of 𝑥, 𝑥 ∈ [0∘ ; 180∘ ], is 𝑓 (𝑥) ⋅ 𝑔(𝑥) < 0? (2)
[9]
f(x) = cos 2x g(x) = sin(x + 30 ∘ )
1.0
0.5
−0.5
−1.0
-180° -135° -90° -45° 0° 45° 90° 135° 180°
THE WORKED MEMO
T11 Trig graphs memo page 26
(a) Period of 𝑓 = 180∘ 3 Range of 𝑔: [−1; 1] 3
(b) cos 2𝑥 = sin(𝑥 + 30∘ ) = cos(60∘ − 𝑥) 3
2𝑥 = 60∘ − 𝑥 + 𝑘 ⋅ 360∘ ⇒ 𝑥 = 20∘ + 𝑘 ⋅ 120∘ 3
2𝑥 = 𝑥 − 60∘ + 𝑘 ⋅ 360∘ ⇒ 𝑥 = −60∘ + 𝑘 ⋅ 360∘ 3
In [−180∘ ; 180∘ ]: 𝑥 ∈ {−100∘ ; −60∘ ; 20∘ ; 140∘ } 33
(c) 𝑓 < 0 and 𝑔 > 0 for 45∘ < 𝑥 < 135∘ ; 𝑓 > 0 and 𝑔 < 0 for 150∘ < 𝑥 ≤ 180∘ .
𝑥 ∈ (45∘ ; 135∘ ) ∪ (150∘ ; 180∘ ] 33
Mark allocation (a) 1 each; (b) 1 co-function, 1 each general case, 2 values in interval; (c) 1 each interval Total 9
© 2026 LVL7 Study Packs ⋅ Licensed for one learner’s personal use. Do not share or resell. 2
,LVL7 Grade 12 Mathematics ⋅ Paper 2 Contents
GRADE 12 MATHEMATICS ⋅ PAPER 2 FINAL EXAM PREP
Contents
40 247 4 100%
original exam-style marks, NSC-style topics, in exam order of questions with a worked
questions allocation memo
Topic Questions No. Marks Questions Memo
page page
1 Statistics & Regression S1–S5 5 38 4 18
2 Analytical Geometry G1–G11 11 65 7 21
3 Trigonometry T1–T14 14 83 9 24
4 Euclidean Geometry E1–E10 10 61 13 28
Total 40 247
How the worked memos are marked (a real question from this pack) 2
How to use this pack, exam conventions, about this pack 31
Mark Tracker and NSC level calculator 32
What is in this pack Who it is for
• 40 original questions (no recycled • Learners: exam-style practice by topic,
past-paper questions), 247 marks (more timed by the marks, with memos you can
than one and a half full Paper 2s’ worth of mark yourself against.
practice) • Parents: a complete, self-marking pack.
• All four Paper 2 topics, in the order and Every question has a worked memo, and the
style of the NSC paper Mark Tracker turns scores into an NSC
• A topic toolkit of must-know facts and level.
methods before each topic • Tutors: original questions with NSC-style
• A worked memo for every question, with mark allocations, and question and memo
the tick-by-tick mark allocation page references for every item.
• Diagrams for every geometry and graph
question
• Every numerical answer re-checked by
computer before publication (page 31)
• A Mark Tracker that converts your score
into an NSC level
© 2026 LVL7 Study Packs ⋅ Licensed for one learner’s personal use. Do not share or resell. 3
,PART A ⋅ TOPIC 1
Statistics & Regression
5 questions ⋅ 38 marks ⋅ about 46 minutes
Questions S1–S5 ⋅ worked memo for this topic starts on page 18
TOPIC TOOLKIT
• Median position 𝑛+1
2
; 𝑄1 = median of the lower half, 𝑄3 = median of the upper half. IQR = 𝑄3 −𝑄1 .
• Five-number summary: (minimum; 𝑄1 ; median; 𝑄3 ; maximum). Outliers lie below 𝑄1 − 1,5×IQR
or above 𝑄3 + 1,5×IQR.
∑(𝑥 − 𝑥)̄ 2
• Standard deviation (NSC uses the population formula): 𝜎 = . Use the STAT mode of
√ 𝑛
your calculator.
• Adding 𝑘 to every value adds 𝑘 to the mean and leaves 𝜎 unchanged. Multiplying every value by
𝑘 multiplies both by 𝑘.
∑ 𝑓 ⋅ (midpoint)
• Grouped data: estimated mean = . An ogive plots cumulative frequency against
𝑛
the upper class boundary.
• Least-squares line 𝑦̂ = 𝑎 + 𝑏𝑥 and correlation 𝑟 from the calculator (A+BX mode). |𝑟| close to 1 =
strong.
S1 Five-number summary and box plot memo p. 18
The Maths test marks (out of 100) of 15 learners are:
34 41 45 48 52 55 55 58 61 63 67 70 74 79 88
(a) Calculate the mean mark. (2)
(b) Write down the five-number summary. (3)
(c) Show that the data has no outliers. (2)
(d) Draw a box-and-whisker diagram and comment on the skewness of the data. (2)
[9]
© 2026 LVL7 Study Packs ⋅ Licensed for one learner’s personal use. Do not share or resell. 4


