
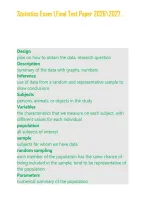
Statistics Exam 1.Final Test Paper 2026\2027.
Design
plan on how to obtain the data, research question
Description
summary of the data with graphs, numbers
Inference
use of data from a random and representative sample to
draw conclusions
Subjects
persons, animals, or objects in the study
Variables
the characteristics that we measure on each subject, with
different values for each individual
population
all subjects of interest
sample
subjects for whom we have data
random sampling
each member of the population has the same chance of
being included in the sample, tend to be representative of
the population
Parameters
numerical summary of the population
, Statistics Exam 1.Final Test Paper 2026\2027.
statistics
numerical summary of the sample
Categorical variables
places an individual into one of several groups or
categories
Graphs for categorical variables
pie charts, bar charts
Quantitative variables
variables that take on numerical values
center
average of the data
variability
spread of the data
discrete variables
take on only a finite list of possible outcomes (whole
number count)
continuous variables
has an infinite list of possible values that form an interval
Graphs used for quantitative variables
dot plots, stem and leaf plots, histograms
Dotplot
Stem and leaf plot


