
2024/12/1 00:09 Week 3_Test Your Knowledge (TYK): PJM6135 71779 Project Quality Management SEC 14 Fall 2024 CPS [BOS-B-HY]
Week 3_Test Your Knowledge (TYK)
Due No due date
Points 100
Questions 10
Time Limit None
Allowed Attempts Unlimited
Instructions
This practice test covers weeks 1-3 course materials, which include an introduction to project quality
management, quality planning, and quality plan implementation. Each answer contains detailed
explanations to help you master the course materials. Take notes as you learn as the final exam will
cover week 1-week 6 course materials.
Test Parameters
Logistics: Online
Number of Questions: 10
Duration: 60 minutes
Possible points: 100 points
Questions Type: Fill in the blank, multiple choice, multiple answer, and matching
Question Delivery: One question at a time
Multiple Attempts: Unlimited
Force Completion: Once started, this Test must be completed in one sitting.
Due date: Sunday of the THIRD week of the course
Take the Quiz Again
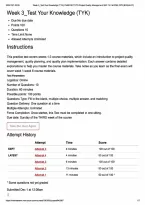
Attempt History
Attempt Time Score
KEPT Attempt 3 6 minutes 100 out of 100
LATEST Attempt 4 4 minutes 90 out of 100
Attempt 3 6 minutes 100 out of 100
Attempt 2 13 minutes 90 out of 100
Attempt 1 11 minutes 90 out of 100 *
* Some questions not yet graded
Submitted Dec 1 at 12:08am
https://northeastern.instructure.com/courses/196393/quizzes/642867 177
, 2024/12/1 00:09 Week 3 Test Your Knowledge (TYK): PUM6135 71779 Project Quality Management SEC 14 Fall 2024 CPS [BOS-B-HY]
Question 1
10/ 10 pts
Which of the following statements is true regarding the normality assumption of a product’s parameters®?
The law of total variance justifies the common assumption that the distribution of a product’'s parameters is normal.
The Gauss—Markov theorem justifies the common assumption that the distribution of a product’s parameters is normal.
Correct!
The central limit theorem justifies the common assumption that the distribution of a product’s parameters is normal.
Bayes' theorem justifies the common assumption that the distribution of a product’s parameters is normal.
The central limit theorem is the foundational principle for statistical process control (SPC). As the size of
the samples increases, the distribution of sample means approaches a normal distribution. The central
limit theorem states that the sampling distribution of the mean of any independent, random variable will
be normal or nearly normal, if the sample size is large enough. The more closely the original population
resembles a normal distribution, the fewer sample points will be required.
Question 2
10/ 10 pts
A p-chart is used when the measure of quality is:
Correct!
Binary.
Out of control.
Common.
Variable.
A p-chart is used when quality is a binary measure. The word binary in this context means that there are
only two decisions: either the product is defective, or it is not defective. The p-chart is a chart for attribute
data. Attributes data describe quality characteristics. We use attributes charts when we evaluate quality
characteristics, such as customer satisfaction or defectiveness of a manufactured item. We may be
interested in the presence or absence of a defect.
Question 3
0/10 pts
The degree to which a product or service meets or exceeds customers’ needs and expectations is called
https://northeastern.instructure.com/courses/196393/quizzes/642867 2/7
Week 3_Test Your Knowledge (TYK)
Due No due date
Points 100
Questions 10
Time Limit None
Allowed Attempts Unlimited
Instructions
This practice test covers weeks 1-3 course materials, which include an introduction to project quality
management, quality planning, and quality plan implementation. Each answer contains detailed
explanations to help you master the course materials. Take notes as you learn as the final exam will
cover week 1-week 6 course materials.
Test Parameters
Logistics: Online
Number of Questions: 10
Duration: 60 minutes
Possible points: 100 points
Questions Type: Fill in the blank, multiple choice, multiple answer, and matching
Question Delivery: One question at a time
Multiple Attempts: Unlimited
Force Completion: Once started, this Test must be completed in one sitting.
Due date: Sunday of the THIRD week of the course
Take the Quiz Again
Attempt History
Attempt Time Score
KEPT Attempt 3 6 minutes 100 out of 100
LATEST Attempt 4 4 minutes 90 out of 100
Attempt 3 6 minutes 100 out of 100
Attempt 2 13 minutes 90 out of 100
Attempt 1 11 minutes 90 out of 100 *
* Some questions not yet graded
Submitted Dec 1 at 12:08am
https://northeastern.instructure.com/courses/196393/quizzes/642867 177
, 2024/12/1 00:09 Week 3 Test Your Knowledge (TYK): PUM6135 71779 Project Quality Management SEC 14 Fall 2024 CPS [BOS-B-HY]
Question 1
10/ 10 pts
Which of the following statements is true regarding the normality assumption of a product’s parameters®?
The law of total variance justifies the common assumption that the distribution of a product’'s parameters is normal.
The Gauss—Markov theorem justifies the common assumption that the distribution of a product’s parameters is normal.
Correct!
The central limit theorem justifies the common assumption that the distribution of a product’s parameters is normal.
Bayes' theorem justifies the common assumption that the distribution of a product’s parameters is normal.
The central limit theorem is the foundational principle for statistical process control (SPC). As the size of
the samples increases, the distribution of sample means approaches a normal distribution. The central
limit theorem states that the sampling distribution of the mean of any independent, random variable will
be normal or nearly normal, if the sample size is large enough. The more closely the original population
resembles a normal distribution, the fewer sample points will be required.
Question 2
10/ 10 pts
A p-chart is used when the measure of quality is:
Correct!
Binary.
Out of control.
Common.
Variable.
A p-chart is used when quality is a binary measure. The word binary in this context means that there are
only two decisions: either the product is defective, or it is not defective. The p-chart is a chart for attribute
data. Attributes data describe quality characteristics. We use attributes charts when we evaluate quality
characteristics, such as customer satisfaction or defectiveness of a manufactured item. We may be
interested in the presence or absence of a defect.
Question 3
0/10 pts
The degree to which a product or service meets or exceeds customers’ needs and expectations is called
https://northeastern.instructure.com/courses/196393/quizzes/642867 2/7


