
transforms to and
i.e., ; a is positive. Shift the graph of through ‘a’ unit towards right.
transforms to .
i.e., is positive. Shift the graph of through ‘a’ units towards left.
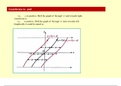
Graphically it could be stated as
, Illustration:
Plot
𝑦 =¿ 𝑥 − 2∨¿ 𝑦 =¿ 𝑥+ 2∨¿
i.e., ; a is positive. Shift the graph of through ‘a’ unit towards right.
transforms to .
i.e., is positive. Shift the graph of through ‘a’ units towards left.
Graphically it could be stated as
, Illustration:
Plot
𝑦 =¿ 𝑥 − 2∨¿ 𝑦 =¿ 𝑥+ 2∨¿



