
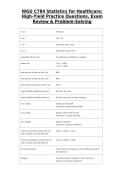
WGU C784 Statistics for Healthcare:
High-Yield Practice Questions, Exam
Review & Problem-Solving
F to C (F-32)/1.8
C to F 1.8C + 32
< or > graph with open circle
≤ or ≥ graph with closed circle
inequalities: flip the sign if multiplying or dividing by a negative
outliers are < Q1 - 1.5IQR
> Q3 + 1.5IQR
what percent of data are w/in 1 sd? 68%
what percent of data are w/in 2 sd? 95%
what percent of data are within 3 sd? 99.7%
single variable categorical data use pie chart, bar chart
single variable quantitative data use dot plot, stem plot, box plot, histogram
C to C data display: two way table
numerical: conditional percentage
C to Q data display: side-by-side box plot
numerical: 5 number summary
Q to Q data display: scatterplot
numerical: correlation coefficient
if data are positively skewed how are mode < median < mean
mean, median and mode affected?
if data are negatively skewed how are mean < median < mode
mean, median and mode affected
for all skewed data... mean follows tail, median is in the middle and mode is
still tallest bar
Integers a number, positive, negative or zero, that has no
fractional or decimal component
High-Yield Practice Questions, Exam
Review & Problem-Solving
F to C (F-32)/1.8
C to F 1.8C + 32
< or > graph with open circle
≤ or ≥ graph with closed circle
inequalities: flip the sign if multiplying or dividing by a negative
outliers are < Q1 - 1.5IQR
> Q3 + 1.5IQR
what percent of data are w/in 1 sd? 68%
what percent of data are w/in 2 sd? 95%
what percent of data are within 3 sd? 99.7%
single variable categorical data use pie chart, bar chart
single variable quantitative data use dot plot, stem plot, box plot, histogram
C to C data display: two way table
numerical: conditional percentage
C to Q data display: side-by-side box plot
numerical: 5 number summary
Q to Q data display: scatterplot
numerical: correlation coefficient
if data are positively skewed how are mode < median < mean
mean, median and mode affected?
if data are negatively skewed how are mean < median < mode
mean, median and mode affected
for all skewed data... mean follows tail, median is in the middle and mode is
still tallest bar
Integers a number, positive, negative or zero, that has no
fractional or decimal component


