
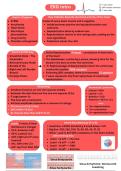
EKG Intro
Used to Diagnose: How it Works: Records electrical activity of the heart
STEMI Inside of every heart muscle cell is negative
Arrythmias Inside becomes positive during depolarization and
Heart block contracts
Electrolyte Depolarization done by sodium ions
abnormalities Repolarization returns to the resting state, waiting on the
Drug toxicity next signal/beat
Chamber enlargement Potassium leaves the cells
Electrical Pathway: 1. Atrial Depolarization (P wave)- contraction of both atria
1. Sinoatrial Node – The of the heart
Pacemaker 2. The Gatekeeper- producing a pause, allowing time for the
2. Atrioventricular Node blood in the atria to enter the ventricles
3. Bundle of His 3. -5- Rapid passage of depolarization down the ventricular
4. Right and Left Bundle conduction system (QRS complex)
Branch Following QRS complex, there is a horizontal ST segment
5. Purkinje Fibers T wave represents the final rapid phase of ventricular
repolarization
Recording: Anatomical Landmarks:
Smallest divisions are one mm squares (0.04s) Inferior = RCA
Between the dark lines are five one mm squares (0.2s) Lateral = LCx
5 large boxes= 1s Anterior = LAD
The time axis is horizontal Posterior = RCA or LCx
Vertical amplitude represents a measure of voltage Ions:
PR interval (0.12-0.20s) Na+ depolarization
QRS width (<0.12s) Ca+ contraction
Qt interval (less than half R-to-R) K+ repolarization/ rest
Leads: 6 chest, 6 limb Heart Rate Methods (R to R):
(Einthoven’s triange) 1. Small Box- 15000 divided by # small boxes = HR
V1-4: Anterior/ LAD 2. Big Box- 300, 150, 100, 75, 60, 50, 43, 37, 33
V5-6: Lateral/ LCx 3. Other- Lead II, #of QRS complexes on the ECG x 6 (10s)
Determining Axis:
aVR: (right arm) P wave
Lead I + & aVF + = Normal
inverted
Lead I + & aVF - = LAD
aVL: (left arm) LCx
Lead I - & aVF + = RAD
aVF: (up from feet) RCA
Lead I - & aVF - = Extreme
Sinus Bradycardia
Sinus Arrhythmia- Normal with
Sinus Tachycardia breathing
, EKG Interpertations
Sick Sinus Syndrome (SSS)
Permanent Pacemaker
→ Sinus pause/ arrest– SA node stops firing - short period of
Keep the heart from
standstill until a lower level pacemaker fires or SA node
going too slow.
resumes normal function - generally less than 3 seconds
Indications: SSS,
Weakness, Fatigue, Palpitations, Near syncope/ syncope
symptomatic
bradycardia, advanced
AV block
Electrolyte
Abnormaliities
K+ (3.5-5)= major intracellular cation; keeps gradient- inside cardiac cells negative
Hyperkalemia- Peaked T Waves Hypokalemia
Speeds ventricular repolarization; 1. ST-segment depression
Can see QT interval shortening 2. Flattening of the T-wave with
PR interval prolonged and P wave prolongation of the QT-interval
flattens and disappears 3. Appearance of a U wave best seen in
the anterior leads
Peaked T No more P Sine wave
Hypermagnesemia > 2.2 mEq/L Hypomagnesaemia < 0.8 mmol/L
↑Magnesium associated with ↑K and ↓Ca
Prolonged PR interval
Toxic: Mg > 4mEq/L
Prolonged QT interval
Increase PR and QT
Predisposition to ventricular
Prolonged QRS
tachycardia and torsade's de pointes
Peaked T waves and flattened P waves
Clacium and the QT Interval
The QT interval shortens at faster heart rates (Hypercalcemia shortens it)
The QT interval lengthens at slower heart rates (Hypocalcemia prolongs it)
Corrected QT interval (QTc): estimates the QT interval at a standard heart rate of 60 bpm
Bazett formula: QTC = QT / √ RR
Normal ⟶ Men: < 440 mms; Women: < 460 mms
An abnormally prolonged QT: an increased risk of ventricular arrhythmias, especially
Torsade's de Pointes
, EKG Interpertations
Pulmonary Embolus
Large S wave in Lead I, ST depression in II, and
a large Q wave in III (with T wave inversion)
Also, with PE, there is usually T wave inversion
in Leads VI through V4. Often there is a RBBB
Sinus tachycardia (40-50% of patients) with R
heart strain
Right Axis Deviation
S1Q3T3 → S-wave in lead I, a Q-wave in lead III,
and T-wave inversion in lead III
Depends on the extent of the burden
Hypothermia < 35 °C
Bradyarrhythmias
Osborne Waves (J waves)- the J point -
where the QRS complex joins the ST
segment
Prolonged PR, QRS and QT intervals
Shivering artefact
Ventricular ectopics
Cardiac arrest due to VT, VF or asystole
Pericarditis
Chest pain: sharp, pleuritic, can change with
position-dyspnea, fever
Exam: can be tachycardic, fever, pericardial
rub
May cause ST elevation and T wave flattening
or inversion
PR depression (V2-6 & aVL, aVF)
Distinguish from MI by:
ST segment is typically concave upward
(saddle shaped)
COPD
QRS of small amplitude
Right Atrial Enlargement, Right
Ventricular Hypertrophy and Right Axis
Deviation
Multifactorial Atrial Tachycardia is also
seen
Used to Diagnose: How it Works: Records electrical activity of the heart
STEMI Inside of every heart muscle cell is negative
Arrythmias Inside becomes positive during depolarization and
Heart block contracts
Electrolyte Depolarization done by sodium ions
abnormalities Repolarization returns to the resting state, waiting on the
Drug toxicity next signal/beat
Chamber enlargement Potassium leaves the cells
Electrical Pathway: 1. Atrial Depolarization (P wave)- contraction of both atria
1. Sinoatrial Node – The of the heart
Pacemaker 2. The Gatekeeper- producing a pause, allowing time for the
2. Atrioventricular Node blood in the atria to enter the ventricles
3. Bundle of His 3. -5- Rapid passage of depolarization down the ventricular
4. Right and Left Bundle conduction system (QRS complex)
Branch Following QRS complex, there is a horizontal ST segment
5. Purkinje Fibers T wave represents the final rapid phase of ventricular
repolarization
Recording: Anatomical Landmarks:
Smallest divisions are one mm squares (0.04s) Inferior = RCA
Between the dark lines are five one mm squares (0.2s) Lateral = LCx
5 large boxes= 1s Anterior = LAD
The time axis is horizontal Posterior = RCA or LCx
Vertical amplitude represents a measure of voltage Ions:
PR interval (0.12-0.20s) Na+ depolarization
QRS width (<0.12s) Ca+ contraction
Qt interval (less than half R-to-R) K+ repolarization/ rest
Leads: 6 chest, 6 limb Heart Rate Methods (R to R):
(Einthoven’s triange) 1. Small Box- 15000 divided by # small boxes = HR
V1-4: Anterior/ LAD 2. Big Box- 300, 150, 100, 75, 60, 50, 43, 37, 33
V5-6: Lateral/ LCx 3. Other- Lead II, #of QRS complexes on the ECG x 6 (10s)
Determining Axis:
aVR: (right arm) P wave
Lead I + & aVF + = Normal
inverted
Lead I + & aVF - = LAD
aVL: (left arm) LCx
Lead I - & aVF + = RAD
aVF: (up from feet) RCA
Lead I - & aVF - = Extreme
Sinus Bradycardia
Sinus Arrhythmia- Normal with
Sinus Tachycardia breathing
, EKG Interpertations
Sick Sinus Syndrome (SSS)
Permanent Pacemaker
→ Sinus pause/ arrest– SA node stops firing - short period of
Keep the heart from
standstill until a lower level pacemaker fires or SA node
going too slow.
resumes normal function - generally less than 3 seconds
Indications: SSS,
Weakness, Fatigue, Palpitations, Near syncope/ syncope
symptomatic
bradycardia, advanced
AV block
Electrolyte
Abnormaliities
K+ (3.5-5)= major intracellular cation; keeps gradient- inside cardiac cells negative
Hyperkalemia- Peaked T Waves Hypokalemia
Speeds ventricular repolarization; 1. ST-segment depression
Can see QT interval shortening 2. Flattening of the T-wave with
PR interval prolonged and P wave prolongation of the QT-interval
flattens and disappears 3. Appearance of a U wave best seen in
the anterior leads
Peaked T No more P Sine wave
Hypermagnesemia > 2.2 mEq/L Hypomagnesaemia < 0.8 mmol/L
↑Magnesium associated with ↑K and ↓Ca
Prolonged PR interval
Toxic: Mg > 4mEq/L
Prolonged QT interval
Increase PR and QT
Predisposition to ventricular
Prolonged QRS
tachycardia and torsade's de pointes
Peaked T waves and flattened P waves
Clacium and the QT Interval
The QT interval shortens at faster heart rates (Hypercalcemia shortens it)
The QT interval lengthens at slower heart rates (Hypocalcemia prolongs it)
Corrected QT interval (QTc): estimates the QT interval at a standard heart rate of 60 bpm
Bazett formula: QTC = QT / √ RR
Normal ⟶ Men: < 440 mms; Women: < 460 mms
An abnormally prolonged QT: an increased risk of ventricular arrhythmias, especially
Torsade's de Pointes
, EKG Interpertations
Pulmonary Embolus
Large S wave in Lead I, ST depression in II, and
a large Q wave in III (with T wave inversion)
Also, with PE, there is usually T wave inversion
in Leads VI through V4. Often there is a RBBB
Sinus tachycardia (40-50% of patients) with R
heart strain
Right Axis Deviation
S1Q3T3 → S-wave in lead I, a Q-wave in lead III,
and T-wave inversion in lead III
Depends on the extent of the burden
Hypothermia < 35 °C
Bradyarrhythmias
Osborne Waves (J waves)- the J point -
where the QRS complex joins the ST
segment
Prolonged PR, QRS and QT intervals
Shivering artefact
Ventricular ectopics
Cardiac arrest due to VT, VF or asystole
Pericarditis
Chest pain: sharp, pleuritic, can change with
position-dyspnea, fever
Exam: can be tachycardic, fever, pericardial
rub
May cause ST elevation and T wave flattening
or inversion
PR depression (V2-6 & aVL, aVF)
Distinguish from MI by:
ST segment is typically concave upward
(saddle shaped)
COPD
QRS of small amplitude
Right Atrial Enlargement, Right
Ventricular Hypertrophy and Right Axis
Deviation
Multifactorial Atrial Tachycardia is also
seen


