
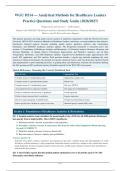
WGU D514 — Analytical Methods for Healthcare Leaders
Practice Questions and Study Guide (2026/2027)
40 Questions and Answers — 2026 Update
Aligned with 2026/2027 Healthcare Analytics Standards, Biostatistics, Financial Modeling, Quality
Metrics, and AI-Driven Decision Support
This practice questions and study guide assesses mastery of analytical competencies within the Western Governors
University (WGU) D514 Analytical Methods for Healthcare Leaders curriculum, covering healthcare data analytics,
biostatistics, financial analysis, decision modeling, quality metrics, predictive analytics, data visualization,
informatics, and 2026/2027 healthcare analytics updates. The 40-question instrument is structured across four
sections: (1) Foundations of Healthcare Analytics and Biostatistics; (2) Financial Analysis, Resource Allocation, and
Decision Modeling; (3) Quality Metrics, Performance Improvement, and Predictive Analytics; and (4) Data
Visualization, Informatics, and 2026 Healthcare Updates. Cognitive-level distribution targets approximately 30%
recall, 50% application, and 20% analysis. Each question includes a step-by-step rationale explaining the exact
statistical or financial mechanism, the rationale for specific analytical choices, and why distractors represent flawed
data interpretations or poor leadership decisions. A grading rubric and solution key concludes the document, defining
the 80% passing and 90% proficient mastery thresholds required for the WGU D514 assessment.
Quick-Reference: Choosing the Correct Statistical Test
Data & Goal Appropriate Test
Compare means of 2 independent groups Independent-samples t-test
Compare means of 2 paired/matched groups Paired t-test
Compare means of 3+ independent groups One-way ANOVA
Association between 2 categorical variables Chi-square test of independence
Predict a continuous outcome from 1+ predictors Linear regression
Predict a binary outcome from 1+ predictors Logistic regression
Discover natural groupings in unlabeled data Unsupervised clustering (k-means)
Detect special-cause variation in a process over time Statistical process control (SPC) chart
Section 1: Foundations of Healthcare Analytics & Biostatistics
Q1: A hospital analytics team calculates the mean length of stay (LOS) for all 4,200 patients discharged
last quarter from a single facility. This is BEST classified as:
A. Inferential statistics, because it generalizes to the population
B. Descriptive statistics, because it summarizes data from the entire study population without inferring
beyond it [CORRECT]
C. Predictive analytics, because it forecasts future LOS
D. Bayesian analysis, because it updates prior probabilities
Correct Answer: B
Rationale: Descriptive statistics summarize and characterize data from a defined group (the full population of 4,200
discharges) without inferring to a larger population. Inferential statistics would use a sample to draw conclusions about a
larger population. Predictive analytics projects future outcomes, and Bayesian methods incorporate prior distributions —
none describe this scenario.
Q2: A nurse leader reports that the median patient satisfaction score is 82 and the mean is 78. This
discrepancy most likely indicates:
Page 1
, WGU D514 Analytical Methods for Healthcare Leaders (2026/2027) — Practice Questions & Study Guide
A. A perfectly symmetrical (normal) distribution
B. A left-skewed distribution with a long tail of low scores [CORRECT]
C. A right-skewed distribution with a long tail of high scores
D. A bimodal distribution with two peaks
Correct Answer: B
Rationale: When the mean (78) is LESS than the median (82), the distribution is left-skewed (negatively skewed), pulled
downward by a long tail of low outlier scores. Right-skewed distributions have mean > median. A symmetrical
distribution has mean ≈ median. Bimodality requires additional evidence of two peaks and cannot be inferred from a
mean/median comparison alone.
Q3: A quality researcher compares readmission rates between two hospitals and reports p = 0.04.
Assuming alpha = 0.05, the correct interpretation is:
A. There is a 4% probability that the null hypothesis is true.
B. There is a 4% probability of observing a difference at least as large as the one found, assuming the null
hypothesis is true; the result is statistically significant [CORRECT]
C. The clinical significance is established.
D. The probability that the alternative hypothesis is true is 96%.
Correct Answer: B
Rationale: The p-value is the probability of obtaining results at least as extreme as observed, ASSUMING the null
hypothesis is true. It is NOT the probability that the null is true, nor the probability that the alternative is true. Statistical
significance (p < alpha) does not establish clinical significance, which requires effect size and clinical judgment.
Q4: A 95% confidence interval for the mean reduction in HbA1c after a diabetes program is [0.8, 1.6].
The BEST interpretation is:
A. 95% of patients experienced a reduction between 0.8 and 1.6.
B. We are 95% confident that the true population mean reduction lies between 0.8 and 1.6 [CORRECT]
C. The probability that the sample mean is in [0.8, 1.6] is 95%.
D. There is a 95% chance the null hypothesis is false.
Correct Answer: B
Rationale: A 95% CI means that, over repeated sampling, 95% of similarly constructed intervals would contain the true
population mean. It does NOT mean 95% of individual patients fall within the interval (that would be a
prediction/tolerance interval), nor that the probability the parameter is in this specific interval is 95% (frequentist
interpretation). CI addresses the location of the population parameter, not individual outcomes.
Q5: A study finds a strong positive correlation (r = 0.78) between hospital staffing ratios and patient
satisfaction scores. Which conclusion is JUSTIFIED?
A. Higher staffing ratios CAUSE higher patient satisfaction.
B. There is a statistical association; causation requires additional evidence such as study design, temporal
ordering, and ruling out confounders [CORRECT]
C. Patient satisfaction causes higher staffing.
D. The correlation proves the staffing ratio should be increased.
Correct Answer: B
Rationale: Correlation indicates association, NOT causation. Establishing causation requires controlled study design,
temporal precedence, biological/plausible mechanism, dose-response, and ruling out confounders. Recommending
intervention based solely on correlation is a leadership error; a third variable (e.g., organizational culture) could drive
both staffing and satisfaction.
Q6: A researcher wants to compare the mean blood pressure reduction across THREE independent
treatment groups. The appropriate statistical test is:
A. Independent-samples t-test
B. Paired t-test
Page 2
Practice Questions and Study Guide (2026/2027)
40 Questions and Answers — 2026 Update
Aligned with 2026/2027 Healthcare Analytics Standards, Biostatistics, Financial Modeling, Quality
Metrics, and AI-Driven Decision Support
This practice questions and study guide assesses mastery of analytical competencies within the Western Governors
University (WGU) D514 Analytical Methods for Healthcare Leaders curriculum, covering healthcare data analytics,
biostatistics, financial analysis, decision modeling, quality metrics, predictive analytics, data visualization,
informatics, and 2026/2027 healthcare analytics updates. The 40-question instrument is structured across four
sections: (1) Foundations of Healthcare Analytics and Biostatistics; (2) Financial Analysis, Resource Allocation, and
Decision Modeling; (3) Quality Metrics, Performance Improvement, and Predictive Analytics; and (4) Data
Visualization, Informatics, and 2026 Healthcare Updates. Cognitive-level distribution targets approximately 30%
recall, 50% application, and 20% analysis. Each question includes a step-by-step rationale explaining the exact
statistical or financial mechanism, the rationale for specific analytical choices, and why distractors represent flawed
data interpretations or poor leadership decisions. A grading rubric and solution key concludes the document, defining
the 80% passing and 90% proficient mastery thresholds required for the WGU D514 assessment.
Quick-Reference: Choosing the Correct Statistical Test
Data & Goal Appropriate Test
Compare means of 2 independent groups Independent-samples t-test
Compare means of 2 paired/matched groups Paired t-test
Compare means of 3+ independent groups One-way ANOVA
Association between 2 categorical variables Chi-square test of independence
Predict a continuous outcome from 1+ predictors Linear regression
Predict a binary outcome from 1+ predictors Logistic regression
Discover natural groupings in unlabeled data Unsupervised clustering (k-means)
Detect special-cause variation in a process over time Statistical process control (SPC) chart
Section 1: Foundations of Healthcare Analytics & Biostatistics
Q1: A hospital analytics team calculates the mean length of stay (LOS) for all 4,200 patients discharged
last quarter from a single facility. This is BEST classified as:
A. Inferential statistics, because it generalizes to the population
B. Descriptive statistics, because it summarizes data from the entire study population without inferring
beyond it [CORRECT]
C. Predictive analytics, because it forecasts future LOS
D. Bayesian analysis, because it updates prior probabilities
Correct Answer: B
Rationale: Descriptive statistics summarize and characterize data from a defined group (the full population of 4,200
discharges) without inferring to a larger population. Inferential statistics would use a sample to draw conclusions about a
larger population. Predictive analytics projects future outcomes, and Bayesian methods incorporate prior distributions —
none describe this scenario.
Q2: A nurse leader reports that the median patient satisfaction score is 82 and the mean is 78. This
discrepancy most likely indicates:
Page 1
, WGU D514 Analytical Methods for Healthcare Leaders (2026/2027) — Practice Questions & Study Guide
A. A perfectly symmetrical (normal) distribution
B. A left-skewed distribution with a long tail of low scores [CORRECT]
C. A right-skewed distribution with a long tail of high scores
D. A bimodal distribution with two peaks
Correct Answer: B
Rationale: When the mean (78) is LESS than the median (82), the distribution is left-skewed (negatively skewed), pulled
downward by a long tail of low outlier scores. Right-skewed distributions have mean > median. A symmetrical
distribution has mean ≈ median. Bimodality requires additional evidence of two peaks and cannot be inferred from a
mean/median comparison alone.
Q3: A quality researcher compares readmission rates between two hospitals and reports p = 0.04.
Assuming alpha = 0.05, the correct interpretation is:
A. There is a 4% probability that the null hypothesis is true.
B. There is a 4% probability of observing a difference at least as large as the one found, assuming the null
hypothesis is true; the result is statistically significant [CORRECT]
C. The clinical significance is established.
D. The probability that the alternative hypothesis is true is 96%.
Correct Answer: B
Rationale: The p-value is the probability of obtaining results at least as extreme as observed, ASSUMING the null
hypothesis is true. It is NOT the probability that the null is true, nor the probability that the alternative is true. Statistical
significance (p < alpha) does not establish clinical significance, which requires effect size and clinical judgment.
Q4: A 95% confidence interval for the mean reduction in HbA1c after a diabetes program is [0.8, 1.6].
The BEST interpretation is:
A. 95% of patients experienced a reduction between 0.8 and 1.6.
B. We are 95% confident that the true population mean reduction lies between 0.8 and 1.6 [CORRECT]
C. The probability that the sample mean is in [0.8, 1.6] is 95%.
D. There is a 95% chance the null hypothesis is false.
Correct Answer: B
Rationale: A 95% CI means that, over repeated sampling, 95% of similarly constructed intervals would contain the true
population mean. It does NOT mean 95% of individual patients fall within the interval (that would be a
prediction/tolerance interval), nor that the probability the parameter is in this specific interval is 95% (frequentist
interpretation). CI addresses the location of the population parameter, not individual outcomes.
Q5: A study finds a strong positive correlation (r = 0.78) between hospital staffing ratios and patient
satisfaction scores. Which conclusion is JUSTIFIED?
A. Higher staffing ratios CAUSE higher patient satisfaction.
B. There is a statistical association; causation requires additional evidence such as study design, temporal
ordering, and ruling out confounders [CORRECT]
C. Patient satisfaction causes higher staffing.
D. The correlation proves the staffing ratio should be increased.
Correct Answer: B
Rationale: Correlation indicates association, NOT causation. Establishing causation requires controlled study design,
temporal precedence, biological/plausible mechanism, dose-response, and ruling out confounders. Recommending
intervention based solely on correlation is a leadership error; a third variable (e.g., organizational culture) could drive
both staffing and satisfaction.
Q6: A researcher wants to compare the mean blood pressure reduction across THREE independent
treatment groups. The appropriate statistical test is:
A. Independent-samples t-test
B. Paired t-test
Page 2


