
Western Governors University C 214
c207 OA STUDY GUIDE
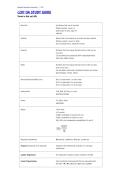
Terms in this set (40)
Nominal Just Names that can be counted
Whole number, count, or
total (color of eyes, type of
vehicle)
Ordinal Names that can be placed in an order and then counted
Whole number, count, or total
(top 10 football teams, satisfaction levels)
Interval Numbers that have equal intervals and an order, but no
true zero
Can be added and subtracted (NOT multiplied/divided)
(shirt size, dates, times)
Ratio Numbers that have equal intervals and an order, but also
have a true zero
Can be added, subtracted, multiplied, divided, and ratioed
(percentages, money, rates)
Normal Distribution/Bell Curve 68.3 % of data within 1 σ of the mean
95.4 % of data within 2 σ of the mean
99.7 % of data within 3 σ of the mean
Intersection "And, Both, All, Every, In a row"
MULTIPLICATION
Union "Or, Either, Other"
ADDITION
Bayes "Given that"
A, B =events
P (A|B) =probability of A given B is true
P (B|A) =probability of B given A is true
P(A), P(B) =the independent probabilities of A and B
Regression Keywords: Relationship, correlation, R-Square, scatter plot
R-square (Goodness of fit) Keywords: strength of the relationship; 0 Weaker to 1 Stronger
relationship
Logistic Regression: The dependent variable is binary (Yes/NO or On/Off)
Linear Programming: Uses Constraints and keywords that are associated with
the letter “M”. Mix, minimize, maximize, optimize
c207 OA STUDY GUIDE
Terms in this set (40)
Nominal Just Names that can be counted
Whole number, count, or
total (color of eyes, type of
vehicle)
Ordinal Names that can be placed in an order and then counted
Whole number, count, or total
(top 10 football teams, satisfaction levels)
Interval Numbers that have equal intervals and an order, but no
true zero
Can be added and subtracted (NOT multiplied/divided)
(shirt size, dates, times)
Ratio Numbers that have equal intervals and an order, but also
have a true zero
Can be added, subtracted, multiplied, divided, and ratioed
(percentages, money, rates)
Normal Distribution/Bell Curve 68.3 % of data within 1 σ of the mean
95.4 % of data within 2 σ of the mean
99.7 % of data within 3 σ of the mean
Intersection "And, Both, All, Every, In a row"
MULTIPLICATION
Union "Or, Either, Other"
ADDITION
Bayes "Given that"
A, B =events
P (A|B) =probability of A given B is true
P (B|A) =probability of B given A is true
P(A), P(B) =the independent probabilities of A and B
Regression Keywords: Relationship, correlation, R-Square, scatter plot
R-square (Goodness of fit) Keywords: strength of the relationship; 0 Weaker to 1 Stronger
relationship
Logistic Regression: The dependent variable is binary (Yes/NO or On/Off)
Linear Programming: Uses Constraints and keywords that are associated with
the letter “M”. Mix, minimize, maximize, optimize


