

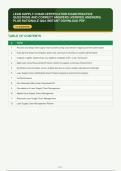
LEAN SUPPLY CHAIN CERTIFICATION EXAM PRACTICE
QUESTIONS AND CORRECT ANSWERS (VERIFIED ANSWERS)
PLUS RATIONALE Q&A INSTANT DOWNLOAD PDF.
120 QUESTIONS
TABLE OF CONTENTS
# TOPIC
1 Analyze and design lean supply chain systems using value stream mapping and flow optimization
2 Evaluate the impact of variability, batch size, and work-in-process on system performance
3 Integrate supplier relationships and logistics strategies within a lean framework
4 Apply lean accounting and performance metrics to support continuous improvement
5 Synthesize lean principles across multiple domains to solve complex operational challenges
6 Lean Supply Chain Certification Exam Practice Questions And Correct Answers
7 Verified Answers
8 Plus Rationale Q&A Instant Download Pdf.
9 Foundations of Lean Supply Chain Management
10 Applied Lean Supply Chain Management
11 Advanced Lean Supply Chain Management
12 Lean Supply Chain Management Review
Page 1
,Q1 ANALYZE AND DESIGN LEAN SUPPLY CHAIN SYSTEMS USING VALUE STREAM
MAPPING AND FLOW OPTIMIZATION
A value stream map shows a process with a total cycle time of 30 minutes, a total
value-added time of 2 minutes, and a total lead time of 14 days. The current state
has a batch size of 100 units. After implementing continuous flow and reducing
batch size to 10 units, the lead time drops to 2 days. What is the new percentage of
value-added time (as a percentage of lead time)?
A. 0.014%
B. 0.069% CORRECT
C. 0.14%
D. 0.69%
RATIONALE: Value-added percentage = (value-added time / lead time) * 100. With continuous
flow, value-added time remains 2 minutes (0.0333 hours). Lead time is 2 days = 48 hours.
Percentage = (0.0333/48)*100 = 0.0694%, approximately 0.069%. Option A incorrectly uses the
original 14-day lead time (0.014%), while C and D misinterpret the conversion.
Q2 ANALYZE AND DESIGN LEAN SUPPLY CHAIN SYSTEMS USING VALUE STREAM
MAPPING AND FLOW OPTIMIZATION
A factory produces a single product at a takt time of 30 seconds. The packaging
process has an observed cycle time of 45 seconds and a failure rate of 5%
(defective units are scrapped). What is the minimum number of parallel packaging
machines required to meet customer demand?
A. 1
B. 2 CORRECT
C. 3
D. 4
RATIONALE: To meet takt time, effective capacity must be demand. Each machine has a cycle
time of 45s and 5% scrap, so good output per machine = (1/45)*(0.95) = 0.02111 units/sec.
Required rate = 1/30 = 0.03333 units/sec. With 2 machines: 0.04222 > 0.03333, so 2 machines
suffice; 1 machine yields 0.02111 < 0.03333. Options C and D are overestimates.
Page 2
,Q3 ANALYZE AND DESIGN LEAN SUPPLY CHAIN SYSTEMS USING VALUE STREAM
MAPPING AND FLOW OPTIMIZATION
In a kanban-controlled system, the container size is 50 units, the lead time for the
upstream process is 2 hours, and the safety stock factor is set at 20%. If the
average demand rate is 200 units per hour, how many kanban cards are needed?
A. 8
B. 10 CORRECT
C. 12
D. 14
RATIONALE: Number of kanbans = (demand during lead time + safety stock) / container size.
Demand during lead time = 200 * 2 = 400. Safety stock = 20% of 400 = 80. Total = 480. Divide by
50 = 9.6, round up to 10. Option A (8) ignores safety stock, C (12) overestimates, D (14) uses a
larger safety factor.
Q4 ANALYZE AND DESIGN LEAN SUPPLY CHAIN SYSTEMS USING VALUE STREAM
MAPPING AND FLOW OPTIMIZATION
Which of the following scenarios best illustrates the 'efficiency paradox' in lean
accounting?
A. A plant increases machine utilization to 95%, but total throughput time increases due to higher
work-in-process inventory.
B. A plant reduces setup time, enabling smaller batch sizes, but the accounting system reports
lower overhead absorption. CORRECT
C. A plant implements a just-in-time delivery system, but transportation costs increase due to
more frequent deliveries.
D. A plant reduces defects, but the cost of quality increases due to more inspection activities.
RATIONALE: The efficiency paradox occurs when improvements like reduced setup time lead to
smaller batches and lower inventory, but traditional accounting measures show reduced
efficiency because overhead absorption declines. Option A describes a throughput problem, C is
a logistics trade-off, and D reflects a quality cost model, not an accounting paradox.
Page 3
, Q5 ANALYZE AND DESIGN LEAN SUPPLY CHAIN SYSTEMS USING VALUE STREAM
MAPPING AND FLOW OPTIMIZATION
A supplier is evaluating a partnership with a lean manufacturer. Which
combination of metrics should the supplier prioritize to align with the
manufacturer's lean goals?
A. On-time delivery, cost per unit, and inventory turns
B. Order accuracy, lead time variability, and total cost of ownership CORRECT
C. Production volume, machine utilization, and batch size
D. Number of change orders, warehouse space, and labor productivity
RATIONALE: Lean supply chains emphasize reliability and reduced variability. Lead time
variability directly affects safety stock; total cost of ownership captures long-term value; order
accuracy reduces disruptions. Option A includes cost per unit but misses variability. C focuses on
internal production, D on administrative measures, neither aligning with lean flow.
Q6 ANALYZE AND DESIGN LEAN SUPPLY CHAIN SYSTEMS USING VALUE STREAM
MAPPING AND FLOW OPTIMIZATION
A cross-docking facility receives 50 trucks per day, each with an average of 20
pallets. The facility operates 8 hours per day. If the average time a pallet spends in
the facility is 30 minutes, what is the average work-in-process inventory (in pallets)
in the facility?
A. 50 pallets
B. 62.5 pallets CORRECT
C. 75 pallets
D. 100 pallets
RATIONALE: Using Little's Law: WIP = throughput rate × flow time. Throughput = 50 trucks * 20
pallets / 8 hours = 1000 pallets / 8 hours = 125 pallets/hour. Flow time = 0.5 hour. WIP = 125 *
0.5 = 62.5 pallets. Option A (50) uses trucks, C (75) and D (100) are miscalculations.
Page 4
QUESTIONS AND CORRECT ANSWERS (VERIFIED ANSWERS)
PLUS RATIONALE Q&A INSTANT DOWNLOAD PDF.
120 QUESTIONS
TABLE OF CONTENTS
# TOPIC
1 Analyze and design lean supply chain systems using value stream mapping and flow optimization
2 Evaluate the impact of variability, batch size, and work-in-process on system performance
3 Integrate supplier relationships and logistics strategies within a lean framework
4 Apply lean accounting and performance metrics to support continuous improvement
5 Synthesize lean principles across multiple domains to solve complex operational challenges
6 Lean Supply Chain Certification Exam Practice Questions And Correct Answers
7 Verified Answers
8 Plus Rationale Q&A Instant Download Pdf.
9 Foundations of Lean Supply Chain Management
10 Applied Lean Supply Chain Management
11 Advanced Lean Supply Chain Management
12 Lean Supply Chain Management Review
Page 1
,Q1 ANALYZE AND DESIGN LEAN SUPPLY CHAIN SYSTEMS USING VALUE STREAM
MAPPING AND FLOW OPTIMIZATION
A value stream map shows a process with a total cycle time of 30 minutes, a total
value-added time of 2 minutes, and a total lead time of 14 days. The current state
has a batch size of 100 units. After implementing continuous flow and reducing
batch size to 10 units, the lead time drops to 2 days. What is the new percentage of
value-added time (as a percentage of lead time)?
A. 0.014%
B. 0.069% CORRECT
C. 0.14%
D. 0.69%
RATIONALE: Value-added percentage = (value-added time / lead time) * 100. With continuous
flow, value-added time remains 2 minutes (0.0333 hours). Lead time is 2 days = 48 hours.
Percentage = (0.0333/48)*100 = 0.0694%, approximately 0.069%. Option A incorrectly uses the
original 14-day lead time (0.014%), while C and D misinterpret the conversion.
Q2 ANALYZE AND DESIGN LEAN SUPPLY CHAIN SYSTEMS USING VALUE STREAM
MAPPING AND FLOW OPTIMIZATION
A factory produces a single product at a takt time of 30 seconds. The packaging
process has an observed cycle time of 45 seconds and a failure rate of 5%
(defective units are scrapped). What is the minimum number of parallel packaging
machines required to meet customer demand?
A. 1
B. 2 CORRECT
C. 3
D. 4
RATIONALE: To meet takt time, effective capacity must be demand. Each machine has a cycle
time of 45s and 5% scrap, so good output per machine = (1/45)*(0.95) = 0.02111 units/sec.
Required rate = 1/30 = 0.03333 units/sec. With 2 machines: 0.04222 > 0.03333, so 2 machines
suffice; 1 machine yields 0.02111 < 0.03333. Options C and D are overestimates.
Page 2
,Q3 ANALYZE AND DESIGN LEAN SUPPLY CHAIN SYSTEMS USING VALUE STREAM
MAPPING AND FLOW OPTIMIZATION
In a kanban-controlled system, the container size is 50 units, the lead time for the
upstream process is 2 hours, and the safety stock factor is set at 20%. If the
average demand rate is 200 units per hour, how many kanban cards are needed?
A. 8
B. 10 CORRECT
C. 12
D. 14
RATIONALE: Number of kanbans = (demand during lead time + safety stock) / container size.
Demand during lead time = 200 * 2 = 400. Safety stock = 20% of 400 = 80. Total = 480. Divide by
50 = 9.6, round up to 10. Option A (8) ignores safety stock, C (12) overestimates, D (14) uses a
larger safety factor.
Q4 ANALYZE AND DESIGN LEAN SUPPLY CHAIN SYSTEMS USING VALUE STREAM
MAPPING AND FLOW OPTIMIZATION
Which of the following scenarios best illustrates the 'efficiency paradox' in lean
accounting?
A. A plant increases machine utilization to 95%, but total throughput time increases due to higher
work-in-process inventory.
B. A plant reduces setup time, enabling smaller batch sizes, but the accounting system reports
lower overhead absorption. CORRECT
C. A plant implements a just-in-time delivery system, but transportation costs increase due to
more frequent deliveries.
D. A plant reduces defects, but the cost of quality increases due to more inspection activities.
RATIONALE: The efficiency paradox occurs when improvements like reduced setup time lead to
smaller batches and lower inventory, but traditional accounting measures show reduced
efficiency because overhead absorption declines. Option A describes a throughput problem, C is
a logistics trade-off, and D reflects a quality cost model, not an accounting paradox.
Page 3
, Q5 ANALYZE AND DESIGN LEAN SUPPLY CHAIN SYSTEMS USING VALUE STREAM
MAPPING AND FLOW OPTIMIZATION
A supplier is evaluating a partnership with a lean manufacturer. Which
combination of metrics should the supplier prioritize to align with the
manufacturer's lean goals?
A. On-time delivery, cost per unit, and inventory turns
B. Order accuracy, lead time variability, and total cost of ownership CORRECT
C. Production volume, machine utilization, and batch size
D. Number of change orders, warehouse space, and labor productivity
RATIONALE: Lean supply chains emphasize reliability and reduced variability. Lead time
variability directly affects safety stock; total cost of ownership captures long-term value; order
accuracy reduces disruptions. Option A includes cost per unit but misses variability. C focuses on
internal production, D on administrative measures, neither aligning with lean flow.
Q6 ANALYZE AND DESIGN LEAN SUPPLY CHAIN SYSTEMS USING VALUE STREAM
MAPPING AND FLOW OPTIMIZATION
A cross-docking facility receives 50 trucks per day, each with an average of 20
pallets. The facility operates 8 hours per day. If the average time a pallet spends in
the facility is 30 minutes, what is the average work-in-process inventory (in pallets)
in the facility?
A. 50 pallets
B. 62.5 pallets CORRECT
C. 75 pallets
D. 100 pallets
RATIONALE: Using Little's Law: WIP = throughput rate × flow time. Throughput = 50 trucks * 20
pallets / 8 hours = 1000 pallets / 8 hours = 125 pallets/hour. Flow time = 0.5 hour. WIP = 125 *
0.5 = 62.5 pallets. Option A (50) uses trucks, C (75) and D (100) are miscalculations.
Page 4


