

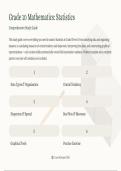
Grade 10 Mathematics: Statistics
Comprehensive Study Guide
This study guide covers everything you need to master Statistics at Grade 10 level. From classifying data and organising
datasets, to calculating measures of central tendency and dispersion, interpreting box plots, and constructing graphical
representations — each section builds systematically toward full examination readiness. Worked examples and a complete
practice exercise with solutions are included.
1 2
Data Types & Organisation Central Tendency
3 4
Dispersion & Spread Box Plots & Skewness
5 6
Graphical Tools Practice Exercise
© E-Loné Scheepers 2026
, CHAPTER 1
Data Types, Collection & Organisation
Before any statistical analysis can begin, data must be correctly identified, classified, and structured. The type of data you
are working with determines which tools and techniques are appropriate. Misclassifying data leads to incorrect methods
and unreliable conclusions. This chapter introduces the two major data classifications and the key tools used to structure
and display raw datasets.
Collect Organise
Gather raw Structure data for
observations and analysis and use
measurements
Classify
Identify data types
and categories
Every statistical investigation follows this fundamental sequence: data is first collected from a population or sample, then
classified by type, and finally organised into a suitable structure for analysis.
© E-Loné Scheepers 2026
,Classification of Data
Categorical (Qualitative) Discrete (Quantitative) Continuous (Quantitative)
Non-numerical data describing Countable numerical values. No Measurable values that can take
attributes or categories. intermediate values are possible any real number within an interval.
between counts.
Hair colour (blonde, brown, Height (1.72 m, 1.735 m…)
black) Number of siblings (0, 1, 2, 3…) Weight, temperature, time
Mode of transport (bus, car, Test score out of 20 Distance travelled
walking) Number of cars in a car park
Pass / Fail status
Discrete data is counted; continuous data is measured. This distinction determines whether you use a bar graph
(discrete) or a histogram (continuous).
© E-Loné Scheepers 2026
, Ungrouped vs. Grouped Data
Ungrouped Data Grouped Data
Raw individual observations listed separately. Best suited Data combined into continuous class intervals, such as
for smaller sample sizes where n ≤ 30. Each exact value is 10 ≤ x < 20. Used for large datasets where n > 30 or where
preserved and visible, allowing precise calculations of the values span a wide range. Individual values within each
mean, median, and mode. interval are lost — only estimates are possible.
Example: 12, 15, 18, 20, 22, 25, 28, 30 Example: 10 < x ≤ 20 with frequency 14
© E-Loné Scheepers 2026
Comprehensive Study Guide
This study guide covers everything you need to master Statistics at Grade 10 level. From classifying data and organising
datasets, to calculating measures of central tendency and dispersion, interpreting box plots, and constructing graphical
representations — each section builds systematically toward full examination readiness. Worked examples and a complete
practice exercise with solutions are included.
1 2
Data Types & Organisation Central Tendency
3 4
Dispersion & Spread Box Plots & Skewness
5 6
Graphical Tools Practice Exercise
© E-Loné Scheepers 2026
, CHAPTER 1
Data Types, Collection & Organisation
Before any statistical analysis can begin, data must be correctly identified, classified, and structured. The type of data you
are working with determines which tools and techniques are appropriate. Misclassifying data leads to incorrect methods
and unreliable conclusions. This chapter introduces the two major data classifications and the key tools used to structure
and display raw datasets.
Collect Organise
Gather raw Structure data for
observations and analysis and use
measurements
Classify
Identify data types
and categories
Every statistical investigation follows this fundamental sequence: data is first collected from a population or sample, then
classified by type, and finally organised into a suitable structure for analysis.
© E-Loné Scheepers 2026
,Classification of Data
Categorical (Qualitative) Discrete (Quantitative) Continuous (Quantitative)
Non-numerical data describing Countable numerical values. No Measurable values that can take
attributes or categories. intermediate values are possible any real number within an interval.
between counts.
Hair colour (blonde, brown, Height (1.72 m, 1.735 m…)
black) Number of siblings (0, 1, 2, 3…) Weight, temperature, time
Mode of transport (bus, car, Test score out of 20 Distance travelled
walking) Number of cars in a car park
Pass / Fail status
Discrete data is counted; continuous data is measured. This distinction determines whether you use a bar graph
(discrete) or a histogram (continuous).
© E-Loné Scheepers 2026
, Ungrouped vs. Grouped Data
Ungrouped Data Grouped Data
Raw individual observations listed separately. Best suited Data combined into continuous class intervals, such as
for smaller sample sizes where n ≤ 30. Each exact value is 10 ≤ x < 20. Used for large datasets where n > 30 or where
preserved and visible, allowing precise calculations of the values span a wide range. Individual values within each
mean, median, and mode. interval are lost — only estimates are possible.
Example: 12, 15, 18, 20, 22, 25, 28, 30 Example: 10 < x ≤ 20 with frequency 14
© E-Loné Scheepers 2026


