

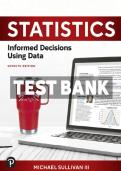
, Accredited Test Bank Solution For
Statistics Informed Decisions Using Data,
7th Edition Sullivan [All Lessons
Included]
Complete Chapter Solution Manual
are Included (Ch.1 to Ch.15)
Rapid Download
Quick Turnaround
Complete Chapters Provided
, Table of Contents are Given Below
"Statistics: Informed Decisions Using Data, 7th Edition" by Michael Sullivan III is structured into four parts,
encompassing 15 chapters:
Part 1: Getting the Information You Need
1. Data Collection
o Introduction to the Practice of Statistics
o Observational Studies and Designed Experiments
o Simple Random Sampling
o Other Effective Sampling Methods
o Bias in Sampling
o The Design of Experiments
Part 2: Descriptive Statistics
2. Organizing and Summarizing Data
o Organizing Qualitative Data
o Organizing Quantitative Data: The Popular Displays
o Additional Displays of Quantitative Data
o Graphical Misrepresentations of Data
3. Numerically Summarizing Data
o Measures of Central Tendency
o Measures of Dispersion
o Measures of Central Tendency and Dispersion from Grouped Data
o Measures of Position and Outliers
o The Five-Number Summary and Boxplots
4. Describing the Relation between Two Variables
o Scatter Diagrams and Correlation
o Least-Squares Regression
PAGE 1
, o Diagnostics on the Least-Squares Regression Line
Part 3: Probability, Probability Distributions, and Sampling Distributions
5. Probability
o Probability Rules
o The Addition Rule and Complements
o Independence and the Multiplication Rule
o Conditional Probability and the General Multiplication Rule
o Counting Techniques
6. Discrete Probability Distributions
o Discrete Random Variables
o The Binomial Probability Distribution
o The Poisson Probability Distribution
7. The Normal Probability Distribution
o Properties of the Normal Distribution
o Applications of the Normal Distribution
o Assessing Normality
8. Sampling Distributions
o Distribution of the Sample Mean
o Distribution of the Sample Proportion
Part 4: Inference: From Samples to Population
9. Estimating the Value of a Parameter Using Confidence Intervals
o Estimating a Population Proportion
o Estimating a Population Mean
o Estimating a Population Standard Deviation
10. Hypothesis Tests Regarding a Parameter
o The Language of Hypothesis Testing
o Hypothesis Tests for a Population Proportion
o Hypothesis Tests for a Population Mean
PAGE 2
, o Hypothesis Tests for a Population Standard Deviation
11. Inference on Two Samples
o Inference about Two Population Proportions
o Inference about Two Means: Dependent Samples
o Inference about Two Means: Independent Samples
o Inference about Two Population Standard Deviations
12. Inference on Categorical Data
o Goodness-of-Fit Test
o Tests for Independence and the Homogeneity of Proportions
13. Comparing Three or More Means (One-Way Analysis of Variance)
o Comparing Three or More Means
o Post Hoc Tests on One-Way Analysis of Variance
14. Inference on the Least-Squares Regression Model
o Inference about the Slope of the Least-Squares Regression Line
o Confidence and Prediction Intervals
15. Nonparametric Statistics
o An Overview of Nonparametric Statistics
o Runs Test for Randomness
o Inferences about Measures of Central Tendency
o Inferences about the Difference between Two Measures of Central Tendency: Dependent Samples
o Inferences about the Difference between Two Measures of Central Tendency: Independent
Samples
o Spearman's Rank-Correlation Test
o Kruskal-Wallis Test of One-Way Analysis of Variance
This comprehensive structure provides a detailed overview of statistical concepts and methods, making it a
valuable resource for students and professionals in the field.
PAGE 3
, Part 1: Data Collection
1. Introduction to the Practice of Statistics
Q1. What is the primary goal of statistics?
A) To collect data
B) To summarize data
C) To make informed decisions based on data
D) To perform experiments
Answer: C) To make informed decisions based on data
Explanation: The primary goal of statistics is to analyze and interpret data to make informed decisions. While
collecting and summarizing data are important steps, the ultimate aim is to use this information for decision-
making.
Q2. Which of the following best describes a population in statistics?
A) A subset of data points from a study
B) The entire group about which information is sought
C) Data collected from an experiment
D) Randomly selected individuals from a study
Answer: B) The entire group about which information is sought
Explanation: In statistics, a population refers to the complete set of individuals, items, or data points that
researchers are interested in studying.
2. Observational Studies and Designed Experiments
Q3. What distinguishes a designed experiment from an observational study?
A) Use of random sampling
B) Control over the assignment of treatments
C) Collection of qualitative data
D) Analysis of existing data
Answer: B) Control over the assignment of treatments
PAGE 4
Statistics Informed Decisions Using Data,
7th Edition Sullivan [All Lessons
Included]
Complete Chapter Solution Manual
are Included (Ch.1 to Ch.15)
Rapid Download
Quick Turnaround
Complete Chapters Provided
, Table of Contents are Given Below
"Statistics: Informed Decisions Using Data, 7th Edition" by Michael Sullivan III is structured into four parts,
encompassing 15 chapters:
Part 1: Getting the Information You Need
1. Data Collection
o Introduction to the Practice of Statistics
o Observational Studies and Designed Experiments
o Simple Random Sampling
o Other Effective Sampling Methods
o Bias in Sampling
o The Design of Experiments
Part 2: Descriptive Statistics
2. Organizing and Summarizing Data
o Organizing Qualitative Data
o Organizing Quantitative Data: The Popular Displays
o Additional Displays of Quantitative Data
o Graphical Misrepresentations of Data
3. Numerically Summarizing Data
o Measures of Central Tendency
o Measures of Dispersion
o Measures of Central Tendency and Dispersion from Grouped Data
o Measures of Position and Outliers
o The Five-Number Summary and Boxplots
4. Describing the Relation between Two Variables
o Scatter Diagrams and Correlation
o Least-Squares Regression
PAGE 1
, o Diagnostics on the Least-Squares Regression Line
Part 3: Probability, Probability Distributions, and Sampling Distributions
5. Probability
o Probability Rules
o The Addition Rule and Complements
o Independence and the Multiplication Rule
o Conditional Probability and the General Multiplication Rule
o Counting Techniques
6. Discrete Probability Distributions
o Discrete Random Variables
o The Binomial Probability Distribution
o The Poisson Probability Distribution
7. The Normal Probability Distribution
o Properties of the Normal Distribution
o Applications of the Normal Distribution
o Assessing Normality
8. Sampling Distributions
o Distribution of the Sample Mean
o Distribution of the Sample Proportion
Part 4: Inference: From Samples to Population
9. Estimating the Value of a Parameter Using Confidence Intervals
o Estimating a Population Proportion
o Estimating a Population Mean
o Estimating a Population Standard Deviation
10. Hypothesis Tests Regarding a Parameter
o The Language of Hypothesis Testing
o Hypothesis Tests for a Population Proportion
o Hypothesis Tests for a Population Mean
PAGE 2
, o Hypothesis Tests for a Population Standard Deviation
11. Inference on Two Samples
o Inference about Two Population Proportions
o Inference about Two Means: Dependent Samples
o Inference about Two Means: Independent Samples
o Inference about Two Population Standard Deviations
12. Inference on Categorical Data
o Goodness-of-Fit Test
o Tests for Independence and the Homogeneity of Proportions
13. Comparing Three or More Means (One-Way Analysis of Variance)
o Comparing Three or More Means
o Post Hoc Tests on One-Way Analysis of Variance
14. Inference on the Least-Squares Regression Model
o Inference about the Slope of the Least-Squares Regression Line
o Confidence and Prediction Intervals
15. Nonparametric Statistics
o An Overview of Nonparametric Statistics
o Runs Test for Randomness
o Inferences about Measures of Central Tendency
o Inferences about the Difference between Two Measures of Central Tendency: Dependent Samples
o Inferences about the Difference between Two Measures of Central Tendency: Independent
Samples
o Spearman's Rank-Correlation Test
o Kruskal-Wallis Test of One-Way Analysis of Variance
This comprehensive structure provides a detailed overview of statistical concepts and methods, making it a
valuable resource for students and professionals in the field.
PAGE 3
, Part 1: Data Collection
1. Introduction to the Practice of Statistics
Q1. What is the primary goal of statistics?
A) To collect data
B) To summarize data
C) To make informed decisions based on data
D) To perform experiments
Answer: C) To make informed decisions based on data
Explanation: The primary goal of statistics is to analyze and interpret data to make informed decisions. While
collecting and summarizing data are important steps, the ultimate aim is to use this information for decision-
making.
Q2. Which of the following best describes a population in statistics?
A) A subset of data points from a study
B) The entire group about which information is sought
C) Data collected from an experiment
D) Randomly selected individuals from a study
Answer: B) The entire group about which information is sought
Explanation: In statistics, a population refers to the complete set of individuals, items, or data points that
researchers are interested in studying.
2. Observational Studies and Designed Experiments
Q3. What distinguishes a designed experiment from an observational study?
A) Use of random sampling
B) Control over the assignment of treatments
C) Collection of qualitative data
D) Analysis of existing data
Answer: B) Control over the assignment of treatments
PAGE 4


