Week 7 Assignment
Dataset: Student Version
Chapter 5: #1, 2, and 5 ; Chapter 6: #1, 2, and 3
Chapter 5
Question 1
NES Student Dataset
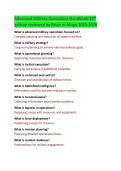
1. Use the Analyze Compare Means Means procedure (with layers) to do
a controlled mean comparison analysis of ft_Tea for each combination of
political_trust and polknow2. Record the means next to the question
marks in the following table.
Political
Knowledge
How often can you
trust federal
government to do Low High Total
what’s right?
Never 46.81 48.19 47.34
Some 48.87 39.79 45.03
About Half 44.82 37.81 42.03
Most 46.08 28.00 38.68
Always 52.03 30.33 46.08
Total 46.96 38.85 43.67
// Just to understand what is going on here. After running a means
comparison of Tea Party ratings on political trust controlling for
political knowledge, I find:
Low Political knowledge respondents: Those who trust the federal
government more give the Tea Party a higher rating on average.
Those who lean towards not trusting the federal government give
the Tea Party a lower rating on average.
High Political Knowledge respondents: Those who trust the
federal government more give the Tea Party a lower rating on
average. Those who lean towards not trusting the federal
government give the Tea Party a higher rating on average.
It is also notable to analyze the trends of the highest and lowest
mean values. The highest mean Tea Party ratings overall is expressed
by low political knowledge respondents, hitting a high mean of 52.03.
We also observe also the highest mean rating for high political
knowledge respondents is 48.19. On the other hand, the lowest mean
Tea Party rating overall is expressed by high political knowledge
respondents giving the lowest mean of 38.85. Meanwhile, we see that
the lowest mean for low political knowledge respondents is 46.81.
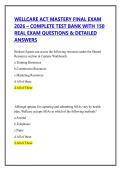
, 2. Create a presentation-quality multiple line chart of the relationship
between the Tea Party thermometer and political_trust, controlling for
polknow2. Print the chart.
3. Consider the numeric table and the graph. Do the results support
Proposition 1? Answer yes or no, and explain
The results from the table and the graph to do not support
Proposition 1. Proposition 1 suggests that at all levels of political
knowledge, individuals who trust the government will give the
Tea Party higher ratings than those who trust the government.
The proposition fails in it’s assumption because when analyzing
the relationship the results vary by levels of political knowledge.
We find that respondents with low political knowledge that tend
to trust the federal government on average give the Tea Party a
lower rating. Meanwhile, respondents with high political
knowledge that distrusting the federal government on average
give the Tea Party a higher rating.
4. Do the results support Proposition 2? Answer yes or no, and explain.
The results from the table and the graph to do not support
Proposition 2. Proposition 2 suggests that he relationship
between political trust and Tea Party ratings will be weaker for
lower-knowledge respondents than for those with higher
knowledge. This proposition is negated by the table and graph
which show the exact opposite. The results show that the higher
knowledge respondents give the lower Tea Party ratings, while
low knowledge respondents give higher ratings.
Dataset: Student Version
Chapter 5: #1, 2, and 5 ; Chapter 6: #1, 2, and 3
Chapter 5
Question 1
NES Student Dataset
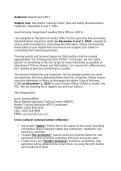
1. Use the Analyze Compare Means Means procedure (with layers) to do
a controlled mean comparison analysis of ft_Tea for each combination of
political_trust and polknow2. Record the means next to the question
marks in the following table.
Political
Knowledge
How often can you
trust federal
government to do Low High Total
what’s right?
Never 46.81 48.19 47.34
Some 48.87 39.79 45.03
About Half 44.82 37.81 42.03
Most 46.08 28.00 38.68
Always 52.03 30.33 46.08
Total 46.96 38.85 43.67
// Just to understand what is going on here. After running a means
comparison of Tea Party ratings on political trust controlling for
political knowledge, I find:
Low Political knowledge respondents: Those who trust the federal
government more give the Tea Party a higher rating on average.
Those who lean towards not trusting the federal government give
the Tea Party a lower rating on average.
High Political Knowledge respondents: Those who trust the
federal government more give the Tea Party a lower rating on
average. Those who lean towards not trusting the federal
government give the Tea Party a higher rating on average.
It is also notable to analyze the trends of the highest and lowest
mean values. The highest mean Tea Party ratings overall is expressed
by low political knowledge respondents, hitting a high mean of 52.03.
We also observe also the highest mean rating for high political
knowledge respondents is 48.19. On the other hand, the lowest mean
Tea Party rating overall is expressed by high political knowledge
respondents giving the lowest mean of 38.85. Meanwhile, we see that
the lowest mean for low political knowledge respondents is 46.81.
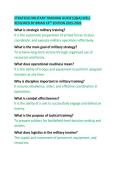
, 2. Create a presentation-quality multiple line chart of the relationship
between the Tea Party thermometer and political_trust, controlling for
polknow2. Print the chart.
3. Consider the numeric table and the graph. Do the results support
Proposition 1? Answer yes or no, and explain
The results from the table and the graph to do not support
Proposition 1. Proposition 1 suggests that at all levels of political
knowledge, individuals who trust the government will give the
Tea Party higher ratings than those who trust the government.
The proposition fails in it’s assumption because when analyzing
the relationship the results vary by levels of political knowledge.
We find that respondents with low political knowledge that tend
to trust the federal government on average give the Tea Party a
lower rating. Meanwhile, respondents with high political
knowledge that distrusting the federal government on average
give the Tea Party a higher rating.
4. Do the results support Proposition 2? Answer yes or no, and explain.
The results from the table and the graph to do not support
Proposition 2. Proposition 2 suggests that he relationship
between political trust and Tea Party ratings will be weaker for
lower-knowledge respondents than for those with higher
knowledge. This proposition is negated by the table and graph
which show the exact opposite. The results show that the higher
knowledge respondents give the lower Tea Party ratings, while
low knowledge respondents give higher ratings.