

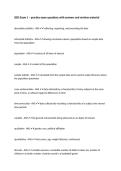
ISDS Exam 1 – practice exam questions with answers and revision material
descriptive statistics - ANS ✔✔collecting, organizing, and presenting the data
inferential statistics - ANS ✔✔drawing conclusions about a population based on sample data
from that population
population - ANS ✔✔consists of all items of interest
sample - ANS ✔✔a subset of the population
sample statistic - ANS ✔✔calculated from the sample data and is used to make inferences about
the population parameter
cross-sectional data - ANS ✔✔data collected by a characteristic of many subjects at the same
point in time, or without regard to differences in time
time series data - ANS ✔✔data collected by recording a characteristic of a subject over several
time periods
variable - ANS ✔✔the general characteristic being observed on an object of interest
qualitative - ANS ✔✔gender, race, political affiliation
quantitative - ANS ✔✔test scores, age, weight (discrete, continuous)
discrete - ANS ✔✔variable assumes a countable number of distinct values (ex. number of
children in a family, number of points scored in a basketball game)
, continuous - ANS ✔✔variable can assume an infinite number of values within some interval (ex.
weight, height, investment return)
nominal scale - ANS ✔✔data are simply categories for grouping the data
ordinal scale - ANS ✔✔there is no objective way to interpret the difference between instructor
quality (ex. instructors are evaluated by excellent, good, fair, poor)
interval scale - ANS ✔✔no absolute 0 or starting point defined
ratio scale - ANS ✔✔data may be categorized and ranked, there is an absolute 0 (ex. weight,
time, distance)
frequency distribution - ANS ✔✔for qualitative data, groups data into categories and records
how many observations fall into each category
relative frequency - ANS ✔✔calculate by dividing each category's frequency by the sample size
cumulative frequency distribution - ANS ✔✔specifies how many observations fall below the
upper limit of a particular class
relative frequency distribution - ANS ✔✔identifies the proportion or fraction of values that fall
into each class
cumulative relative frequency distribution - ANS ✔✔gives the proportion or fraction of values
that fall below the upper limit of each class
descriptive statistics - ANS ✔✔collecting, organizing, and presenting the data
inferential statistics - ANS ✔✔drawing conclusions about a population based on sample data
from that population
population - ANS ✔✔consists of all items of interest
sample - ANS ✔✔a subset of the population
sample statistic - ANS ✔✔calculated from the sample data and is used to make inferences about
the population parameter
cross-sectional data - ANS ✔✔data collected by a characteristic of many subjects at the same
point in time, or without regard to differences in time
time series data - ANS ✔✔data collected by recording a characteristic of a subject over several
time periods
variable - ANS ✔✔the general characteristic being observed on an object of interest
qualitative - ANS ✔✔gender, race, political affiliation
quantitative - ANS ✔✔test scores, age, weight (discrete, continuous)
discrete - ANS ✔✔variable assumes a countable number of distinct values (ex. number of
children in a family, number of points scored in a basketball game)
, continuous - ANS ✔✔variable can assume an infinite number of values within some interval (ex.
weight, height, investment return)
nominal scale - ANS ✔✔data are simply categories for grouping the data
ordinal scale - ANS ✔✔there is no objective way to interpret the difference between instructor
quality (ex. instructors are evaluated by excellent, good, fair, poor)
interval scale - ANS ✔✔no absolute 0 or starting point defined
ratio scale - ANS ✔✔data may be categorized and ranked, there is an absolute 0 (ex. weight,
time, distance)
frequency distribution - ANS ✔✔for qualitative data, groups data into categories and records
how many observations fall into each category
relative frequency - ANS ✔✔calculate by dividing each category's frequency by the sample size
cumulative frequency distribution - ANS ✔✔specifies how many observations fall below the
upper limit of a particular class
relative frequency distribution - ANS ✔✔identifies the proportion or fraction of values that fall
into each class
cumulative relative frequency distribution - ANS ✔✔gives the proportion or fraction of values
that fall below the upper limit of each class


